


SWAT CAM vs. Human: The Future of Plant Stand Counting
Thursday, February 13, 2025 9:54 AM
Reading Time: 2 minutes

An important step in the SWAT MAPS process and step 8 in the SWAT ECOSYSTEM, is viewing the available data that actualizes plant stand counts in the field. This helps verify how well the crop is establishing in each SWAT zone, and it’s done using one of SWAT CAM’s most revolutionary features of automating the manual process of driving fields.
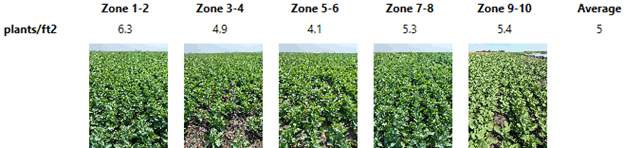
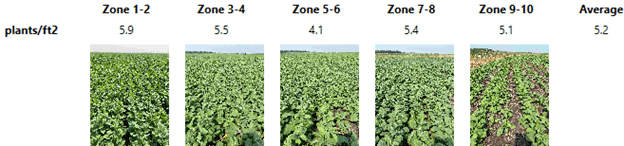
The two figures below show manual plant counts from two fields on the same farm. The manual counts for Field 1 averaged 5 plants / sq ft and Field 2 averaged 5.2 plants / sq ft. This is great because we achieved the target plant stand of 5 plants / sq ft for both fields!
However, SWAT CAM data reported Field 1 averaging 4.5 plants / sq ft and field 2 averaging 3.1 plants / sq ft as shown in the SWAT CAM reports below. As well, Field 2 had the lowest average population on the farm. If we’re looking to improve variable rate strategies on a farm, this data suggests we should be focusing on why Field 2 population was low. Keep in mind the manual counts suggested these fields had similar population and no further investigation was necessary.
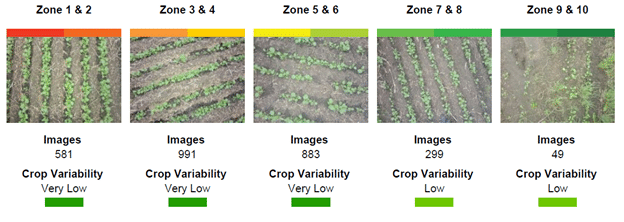
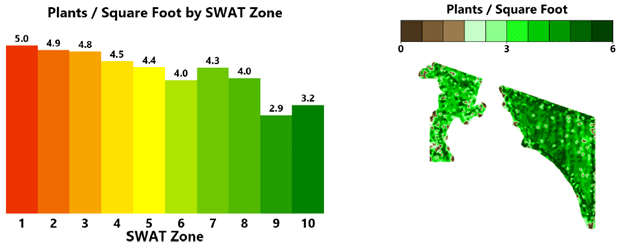
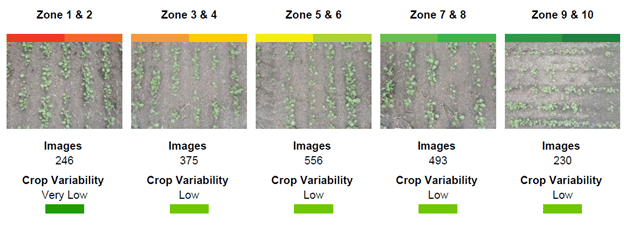
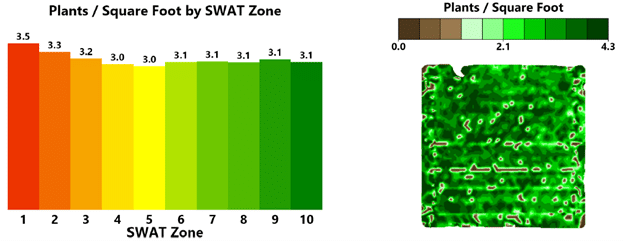
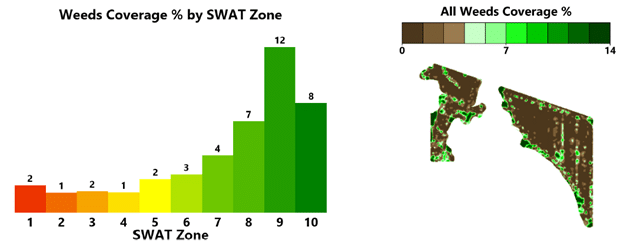
Notice a trend? In Field 1, good crop establishment was apparent in SWAT zones 1 to 8, but zones 9 and 10 were below target. This demonstrates how SWAT CAM data comes in useful once again by indicating high weed pressure in SWAT zones 9 and 10. Once these images are automatically uploaded to our SWAT RECORDS software, we can zoom in on specific images within the weedy areas which reveals moisture loving weeds. When we view the map in 3D, we see zones 9 and 10 are in low lying areas of the field indicating a water management issue.
So, did our field technician do a poor job at counting plants? The simple explanation is we just can’t expect representative data for large fields counting in just a few locations. Of course, it’s not practical to manually count thousands of locations across every field of the farm either. As well, humans can be biased. We are drawn to counting plants in areas of the field that look good so information from manual counts is often skewed to the positive.
SWAT CAM counted 2,800 locations in Field 1 and 1,900 locations in Field 2 using a consistent non-biased method. It’s hard to compete with that resolution and consistency. It’s also hard to compete with the economics of field technicians spending most of their day behind a wind shield to collect low resolution data versus automated cameras getting a free ride on a sprayer across the whole farm.
Interested in how SWAT CAM autonomous plant stand counting works? Give this a read.
Interested in getting your own full farm report card on crop establishment and weed pressure by SWAT zone? We’re happy to chat and get you the tools you’re looking for. Get in touch today.
Become a SWAT News insider!
Sign Me Up!
Join Our Mailing List
Enter your email below to sign up for our mailing list.
We care about the protection of your data. We’ll never share your details.

Croptimistic Technology Inc. is an international agriculture technology (AgTech) company. We began operating in 2018. Croptimistic is supported by a growing team of professionals who have dedicated their careers to developing the best soil mapping software and hardware in the world.
Copyright Croptimistic Technology Inc. © 2025 All Rights Reserved.
Privacy Policy