Precision Ag vs. Hydrology: Different Problems, Same Solutions
Precision agriculture has provided farmers with a multitude of tools to manage and optimize crop production. However, there are many different approaches out there to do the same thing, which at the end of the day creates a lot of conflicting information and ideas. So how can we distinguish the signal from the noise at the end of the day? One approach is to look at other disciplines to see how they have handled common problems.
Meet Phillip Harder, Research Director and Hydrological Scientist
Before I started at Croptimistic, I spent 16 years doing academic hydrological research (in different roles from grad student to research associate at the University of Saskatchewan) so it’s been fascinating to explore some of the common challenges faced by both the precision ag industry and the hydrological research community. Here are a few key items that I’ve learned:
1. People Use The Tools They Know
There are many different hydrological models that have different purposes, but hydrologists used the models that they were familiar with or were developed by themselves or their colleagues. Therefore, a lot of hydrological research may be based on using the most convenient model (tool) rather than the best one for the job. Humans tend to stick to habit and often run out of time to try new things, so we often end up using the same tools that we know. There is value in using tools that you know well, but that does not mean that you should use a high lift farm jack for everything. All tools, whether they are hydrological models or precision ag approaches, have a built-in bias to solve a particular problem. We need to be careful not to apply tools outside of their intended use so that we don’t inadvertently end up with broken jaws.
Case Study: How hydrologists make their choice of model (Addor and Melsen, 2019)
· 1529 published papers published in hydrology between 1991 to 2018 were examined.
· In 74% of all cases, the model selected was determined by the institution of the paper’s author.
2. Quantifying Spatial Variability in Landscapes
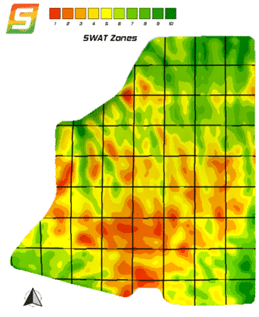
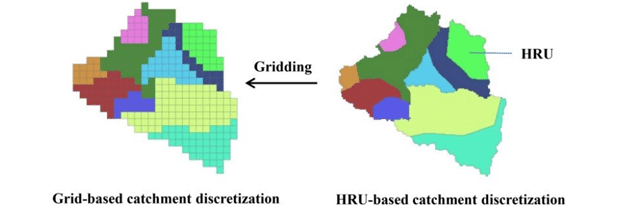
The goal of quantifying spatial variability may vary (hydrologists want to know how much streamflow a basin will produce whereas a farmer is more interested in how a crop will respond to specific management actions), but in the end it’s the same question. In practise this leads to differences in approaches like grid versus zone-based management strategies in precision agriculture (Figure 1), which are similar to fully distributed and hydrological response unit-based approaches in hydrology (Figure 2). A hydrological response unit (HRU) is an area of equivalent hydrological response defined by landscape and soil attributes. A grid or fully distributed approach often treats the landscape as a grid/raster at a high resolution and every location/grid point needs to have data.
Figure 1 shows a SWAT MAP with a 2-acre grid superimposed on top and it is apparent that this level of gridding does not approach the resolution needed to capture the spatial patterns of the SWAT MAP. A gridded representation of a watershed (bottom left in Figure 2) has significantly more grid elements, which break the landscape up into squares and which all need numbers, versus an HRU equivalent representation which only needs a single set of numbers for each HRU that align with the landscape elements (bottom right in figure 2). In the SWAT zone delineation process we are using the interpretation of electrical conductivity and topographic data, to produce the HRU equivalent but in this case for areas of consistent and stable SWAT properties that will affect crop productivity in similar ways.
There is a long-standing debate in how to think about and divide a landscape in hydrology that reflects what is happening in many precision agriculture discussions. Is the uncertain and indirect information found everywhere (e.g., remote sensing of NDVI) valuable enough to make better decisions as opposed to detailed point scale observations that are required for each grid point?
3. Making Decisions Amid Uncertainty
The underlying question in this landscape representation debate is, how can we make good decisions when everything is uncertain? Hydrologists have some experience with this. We often have insufficient information and limited data for every variable, and sometimes we need to provide answers in data-scarce situations (a common hydrological example is the prediction of streamflow in an arctic river where there are no stream gauges or weather stations for thousands of kilometers). The same challenge occurs in agriculture, where measuring every relevant soil and fertility variable at every 0.25m grid cell, for every 10 cm soil layer depth, over a field is not economically feasible, but we still want to spatially adjust our inputs to optimize production. So how can we improve our decisions with incomplete information?

There are two primary approaches to do this in hydrology:
1. Empirical Models: A hydrologist puts together a conceptual or statistical model of how a hydrological system works and then defines factors to describe the interactions. There is no requirement for any of this to be connected to reality, because with enough data, anything can be calibrated to give a “good” answer. This is a data-driven approach that assumes that the available data can capture all the variability and relationships of interest. The problem is that this approach may not work when conditions are outside the range of the calibration datasets. This is the typical case where correlation works well, but correlation does not imply causation.
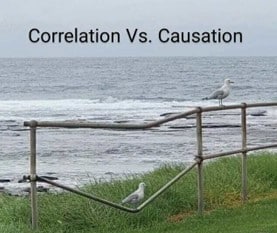
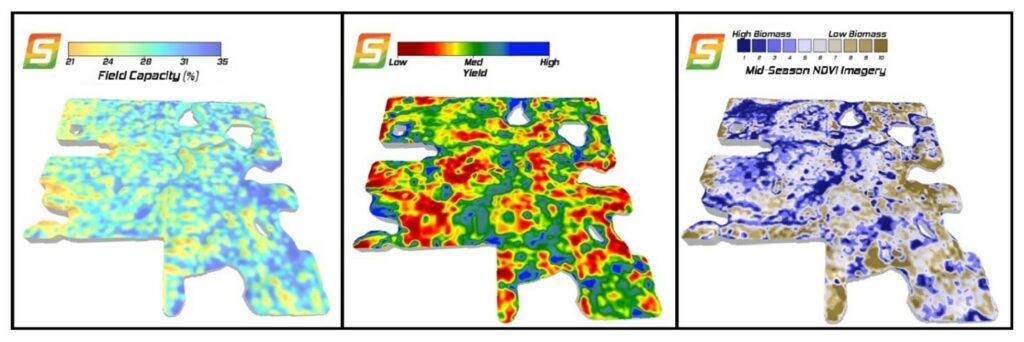
Just because some predictor (like NDVI) shows a correlation with the four years of yield data that we may have, it does not mean that the next year will have the same spatial pattern in yield. For example, we may get a drought where the kochia thrives while the crop fails. Our remote sensing NDVI, that cannot differentiate between kochia and crop, will not capture the significant yield drop.
2. “Process-Based” Approach:I will state my bias that this is my preferred option. Basically, in this approach, we try to go back to first principles and build a model to focus on physical processes (things that can be described by physics) that we know are true. So, using the same Kochia example, if we know from our SWAT MAP the water holding capacity of a SWAT zone (Figure 3) and weather conditions, we can calculate the amount of crop available water with the SWAT WATER model. Because crop water use efficiency is relatively stable, we can more realistically anticipate the yield in year 5, even if we do not have any data for similar weather conditions. Not only can we better anticipate and manage for a different outcome, but we will be able to understand why this is occurring which is information to help us do better next time.
The SWAT MAPS Approach
We can learn from the similarities between hydrological and precision ag challenges. We should use tools that are suitable for our challenges, not just familiar ones, and base our decisions on process-level understanding, not more irrelevant data. The SWAT MAPS approach follows this principle. It is true that "you can't manage what you don't measure", but we also need to avoid "managing what we measure". Yield is the final agronomic goal, but we do not manage yield directly. NDVI shows biomass patterns, but it may not relate to yield, so we can be led astray. What we manage are inputs, and how their response potential varies with soil, water, and topography. So, focusing on the static soil properties that SWAT MAPS use, and managing them accordingly, gives us the process-based understanding to quantify and manage the spatial variability of crop production.
REFERENCES
Addor, Nans & Melsen, L.A.. (2019). Legacy, Rather Than Adequacy, Drives the Selection of Hydrological Models. Water Resources Research. 10.1029/2018WR022958.
Johnson et al 2023. https://topsoil.nserl.purdue.edu/~flanagan/erosymp2023/Presentations/23507-Billy_Johnson.pdf


