


Insights from the Glacier FarmMedia Discovery Farm: 4+ Years of Data Driven Learning
Thursday, June 20, 2024 9:38 AM
Reading Time: 4 minutes
Wes Anderson
VP of Agronomy
wes@swatmaps.com
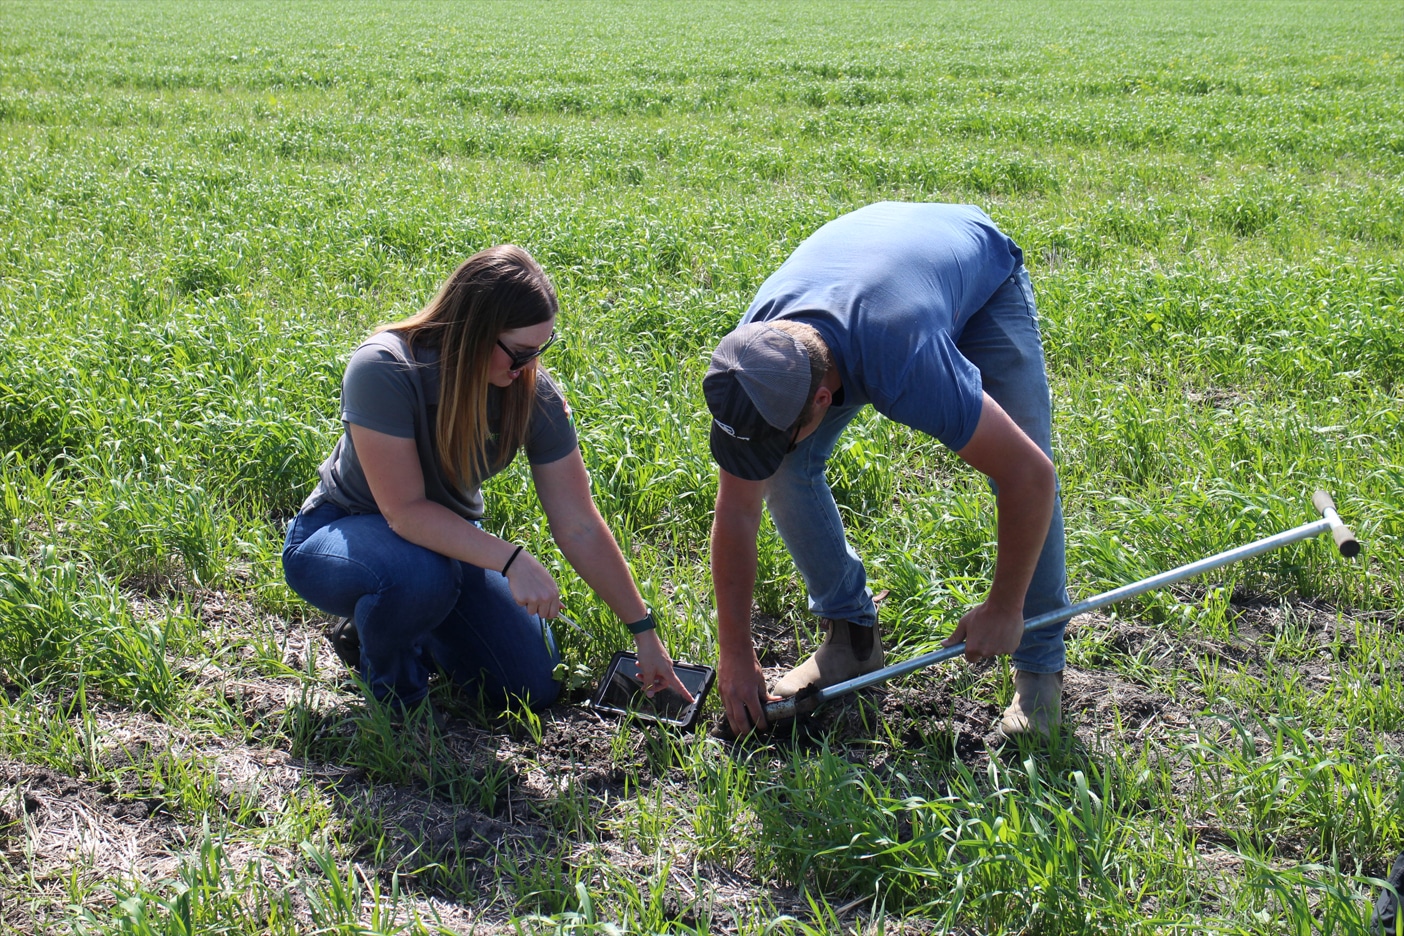
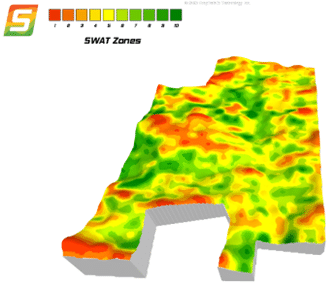
Croptimistic Technology has demonstrated uses of precision ag technology at Glacier FarmMedia Discovery Farm at Langham, SK since 2020. It has been an interesting experience, as the site has some incredibly variable soil despite the low relief topography. It is a classic example of how crop variability is influenced by texture, topography, and salts. Understanding and capturing all these influences in a management zone map is critical for variable rate input applications.
Some history of crops and average yields are shown in Table 1. 2020 had good in-season rainfall resulting in particularly good yields, while the following 3 years have been much below average rainfall seasons.
| Year | Crop | Yield (bu/ac) |
| 2020 | CWRS Wheat | 70 |
| 2021 | Flax | 10 |
| 2022 | CWRS Wheat | 20 |
| 2023 | Canola | 23 |
There is a lot to talk about with this many years of data and the consistency of crop emergence, weed pressure, yield, and nutrient trends by SWAT zone, but this article will focus specifically on long-term nutrient balances.
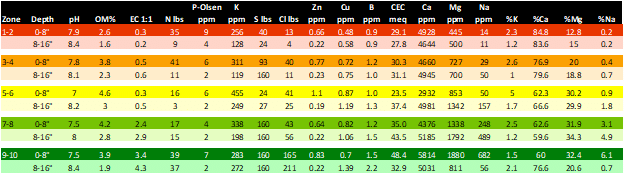
Why does a long-term balance matter? For many nutrients, especially P and K, understanding what has been removed versus applied over a long term indicates whether or not we are slowly building or mining the soil nutrient bank. Initial soil P levels on this field were lower than desired. One of the initial goals was to build (or at least maintain) soil P in SWAT zones 3-8 that did not have yield potential constrained by soil properties such as the salinity found in zones 9-10 or sandy subsoils like in zone 1. While the topsoil (0 to 8") soil tests (Table 2) showed high levels of K, subsoil (8 to16”) showed a much different scenario related to sandier textures in zones 1-4. Therefore, the goal was to maintain soil K in zones 1-4 to avoid further depletion of the soil K pool.
Those goals have largely been achieved, with strong positive P balances in target zones, in part due to such low yields in drought years. Zones 1-5 have maintained a good balance of K with removal, mostly by reallocation of potash to those zones not just for K, but for chloride as well.
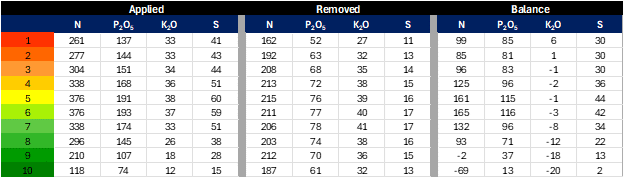
*Nutrients removed were calculated from harvest yield data and assumed values from the Prairie Nutrient Removal Calculator (https://prairienutrientcalculator.info/).
The nitrogen history has been far more interesting. The consistency in zones 5-6 having low soil nitrate despite the highest applied N rates and positive N balance is intriguing. Conversely, zones 1-2 and 9-10 have test results that are consistently high in soil nitrates, despite always having the lowest applied N rates. This is partly explained by the differences in yield and nutrient removal, but not fully. The overall N balance in zone 10 is -69 lbs, so how is it still testing so high in N? How is zone 5-6 testing so low with an N balance of +161? In the most recent soil test result from fall of 2023, nitrate-N is higher than starting levels in 2020, but that does not account for the difference.
| SWAT Zone | Spring 2020 | Fall 2020 | Fall 2021 | Fall 2022 | Fall 2023 |
| 1-2 | 17 | 35 | 113 | 40 | 63 |
| 3-4 | 8 | 41 | 93 | 33 | 64 |
| 5-6 | 7 | 16 | 60 | 31 | 16 |
| 7-8 | 5 | 17 | 120 | 31 | 15 |
| 9-10 | 15 | 39 | 53 | 80 | 49 |
There could be a few reasons:
- Nitrate movement: Some nitrates dissolved in water could be moving from upper landscape positions (zones 1-5) to lower landscape positions (zones 6-10). This is an exceedingly difficult thing to measure, but a few lbs of N per year moving downslope within the field is plausible.
- Net mineralization and immobilization: Zones 9-10 have grown little yield and biomass due to soil salinity and sodicity constraints, and therefore have few carbon inputs which could be resulting in a lot of mineralization. Alternatively, zones 5-7 have consistently had the highest biomass and carbon inputs, and therefore are potentially building soil carbon levels. In other words, a portion of the mineral nitrogen could be immobilized in the organic N pool. We tend to see this phenomenon of “N-starved” soils occurring in zones that have historically been under-fertilized for many, many years and it can take several years to get them to a point where they seem to have enough. On the other hand, we also see many examples of zones that have historically had too much N applied, and similarly take many years to deplete the excess soil nitrate pool to more reasonable levels that do not risk environmental losses.
- Losses: Nitrate losses via leaching or denitrification would seem the most probable cause, except it has not been wet enough to cause significant amounts of either since 2020! Even if there had been enough rainfall or runoff to cause significant denitrification, it would mostly occur in lower landscape positions in zones 8-10, not zones 4-7.
The genuine answer may encompass all three reasons above, as few things in agronomy are very straight forward. One important lesson from this is that soil is a far more immense pool of nutrients than we typically realize. A 0 to8” topsoil with 4% organic matter typically contains over 5000 lbs/ac of total N (organic + mineral N). Making changes to the soil and its available pool of nutrients can take time and patience, but eventually it happens. And for those with no patience, there’s manure!
The second most important lesson is related to the first – to understand nutrient response, we need to understand the soil. Not just in “average” parts of the field, but in all parts of the field. On the Discovery Farm, the opportunity to save money exists in the parts of the field one would typically ignore with composite soil sampling. But by mapping and testing these areas, we can confirm that they do not need the same rates as the rest of the field does. A composite sample would likely be taken in zones 4-6 and would have resulted in higher rates of fertilizer applied and poorer returns.
This is only a fraction of what we have learned so far applying SWAT agronomy at the Discovery Farm. At the time of writing, things are looking much more promising for an end to the drought. Whenever that does happen, I am sure there will be even more to learn.
Interested in hearing more? Visit us on site at Discovery Farm this summer during Ag in Motion, July 16, 17 & 18. The SWAT MAPS team will be at booth #436.
Become a SWAT News insider!
Sign Me Up!
Join Our Mailing List
Enter your email below to sign up for our mailing list.
We care about the protection of your data. We’ll never share your details.

Croptimistic Technology Inc. is an international agriculture technology (AgTech) company. We began operating in 2018. Croptimistic is supported by a growing team of professionals who have dedicated their careers to developing the best soil mapping software and hardware in the world.
Copyright Croptimistic Technology Inc. © 2025 All Rights Reserved.
Privacy Policy