


Using SWAT MAPS to optimize fertility recommendations, reduce crop Inputs, and save $$$
Wednesday, May 1, 2024 11:53 AM
Reading Time: 6 minutes
Sean Barath
Precision Agronomist
sean.barath@swatmaps.com
Introduction
Every fertilizer recommendation should start with soil test data. Without soil test data you would basically be making blind recommendations, based on yield goals and crop uptake/removal tables. This is not an ideal method of nutrient planning as you could either over or under apply certain nutrients.
Soil Testing
Composite soil testing (Table 1) can be a good starting point for making fertilizer recommendations for flat rate applications; however, it only captures soil nutrient levels in the mid-slope areas of fields, leaving out important information on soil nutrient levels in depressions or hilltops. Implementing zone-based soil sampling (Table 2) along with the use of SWAT MAPS variable rate seed and fertilizer can help producers get their best ROI on inputs and save money.
Table 1. Example of composite soil sampling test results.

Table 2. Example of zone-based soil sampling test results.
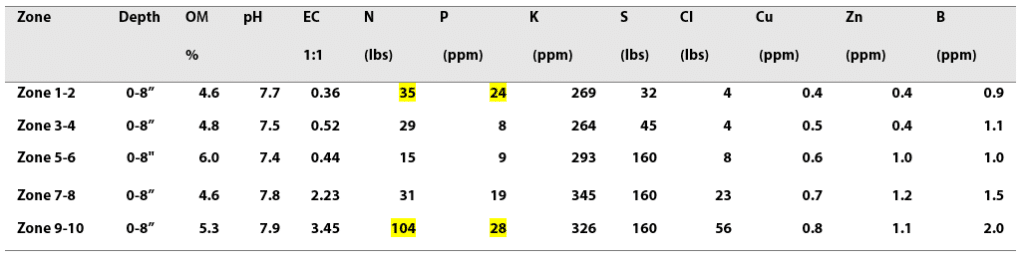
Right away, the zone soil test results in Table 2 show some potential cut back on nitrogen and phosphorus rates in upper and lower SWAT MAPS zones. Zones 1-2 are hilltops where the yield is most limited by low moisture levels, whereas zones 7-10 start getting into yield-limiting levels of salinity. There are already higher soil nitrate and phosphate levels in these areas which will also influence the recommendation for these zones. The zone soil test also sheds some light on other soil factors that the composite sample does not show. The pH levels are elevated in zones 1-2 and 7-10, OM differences between zones are significant and sulfur and zinc levels in zone 1-4 are lower.
Fertility Recommendations
The process of making fertility recommendations based on a SWAT MAP is simply not a button to hit that gives a recommendation. Agronomists are in contact with the farmer early in the fall to discuss any fall fertilizer passes, and then again in the winter for spring plans. In some cases, the grower has a set fertilizer budget to work with, while other growers want a fertility plan more aligned with yield goals and soil test results. Once agronomists have the grower's intended fertility plan, VR recommendations can begin.
Soil test results (Table 2) are the main tool to determine crop demand for a certain yield goal. The soil test is also very useful in determining the soil N supply, including left-over nitrates, organic matter credits, and N credits for cases like previous pulse crops, broken up hay/alfalfa land or previous manure applications. A critical soil test N level of 20 lbs/ac is used. If levels are below this threshold at year end, the crop was potentially starved. If levels are higher than 20 lbs/ac, the crop was supplied with too much N, other factors limited yield and nutrient uptake, or the soil mineralized more nitrate in season that the crop didn't use. When making recommendations, the crop is supplied with enough N for the yield goal while maintaining the 20 lb/ac level at year end. N credits can be tricky as there aren't absolute numbers for the mineralization rate and amount of N coming from the organic matter, pulse crop residue, old hay residue, or manure applications. Organic matter credits can range from 6-8 lbs of N per % OM but can be unpredictable in terms of the above-mentioned practices. When making zone-based recommendations with N credits, the size of credit given can also be based on the landscape position of the field. Zones 1-2 usually have the lowest N credit per % OM as these areas tend to be driest, resulting in less mineralization. In Zones 3-8, credits gradually increase due to higher mineralization potential in lower landscape areas as soil moisture and organic matter content increases. Zones 9-10 can have the highest N credit unless poor health limits microbial activity.
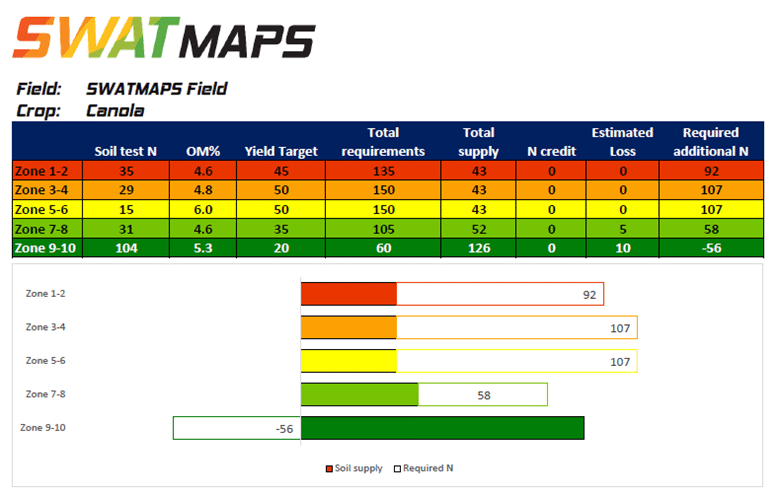
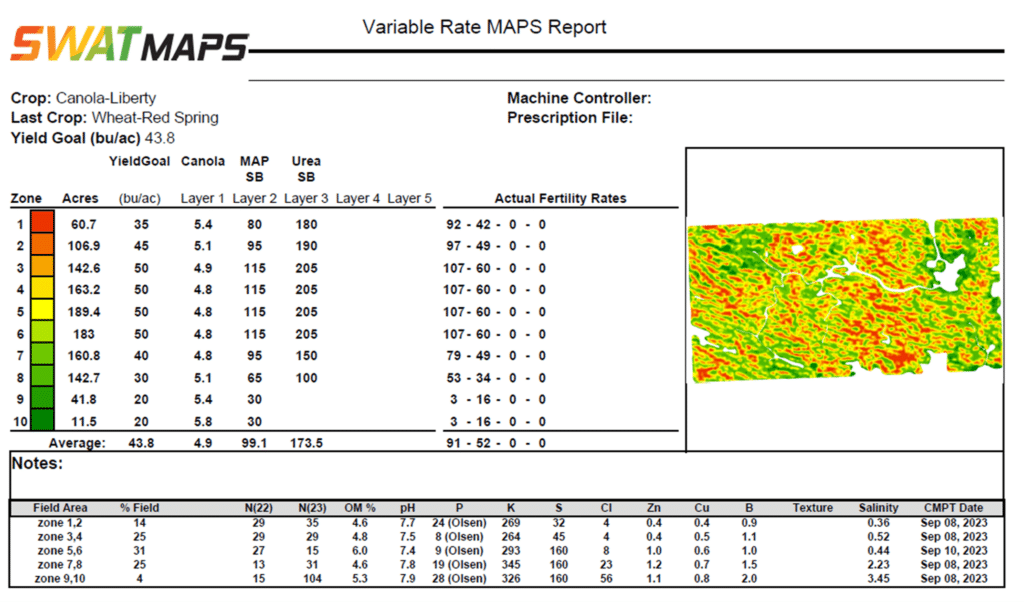
The example SWAT MAPS Field in Figure 1 has soil nitrate levels of 15 lbs to 104 lbs. The zone trend is common, especially after drought years where the zone 1-2's (hills) and zone 7-10's (saline areas) both have high soil nitrate levels where the crop use was low. The organic matter levels range from 4.6 to 6%. The average canola yield goal for this field is 45 bu/ac; however, yield goals per zone do vary based on zone characteristics that limit yield potential. Canola is a heavy user of N, using roughly 3 lbs N per bushel of grain produced. Using the yield goals from Figure 1 would result in crop demand ranging from 105 lbs actual N to 150 lbs actual N. Crop demand is an easy starting point to begin making the recommendation. Total soil supply includes residual nitrates plus N credits from organic matter, minus any losses that may happen and minus the 20 lb/ac year end critical level. Losses are hard to predict but N losses in lower, saturated areas within a field due to denitrification are more likely to happen. There can be leaching losses in sandy areas as well with very wet conditions. Once soil supply is determined, this amount is subtracted from crop demand and the remaining fertilizer requirements are made into a VR report.
In a SWAT MAPS recommendation for P, 15 ppm Olden-P generally is the critical level. Less than 15 ppm is low and zone(s) testing low will receive higher P rates to increase the soil test P level to above 15 ppm. If the soil test level is higher than 15 ppm, maintenance rates are applied to the zone(s) to maintain the soil test levels above 15 ppm. If soil test levels are high, to a point where they become an environmental concern, lower P rates are applied to allow the crop to mine the excess P from the soil. In the SWAT MAPS field example, the soil test in Table 2 shows zones 3-6 are well below the critical level of 15 ppm. These areas are the focus for the VR phosphate application. Zones 1-2 and 7-10 soil test levels are above the critical level and will receive maintenance rates. Depending on yield limiting factors, lower P rates may be applied to allow the crop to mine from the soil. Saline areas and fields that have had excessive manure applications in the past are some examples of where mining soil P instead of maintaining the levels would occur. Table 3 has recommended application rates from AGVISE Laboratories for P based on soil test levels and yield goals. Canola is a heavy user of P, removing roughly 0.9 lbs of P2O5 per bushel of canola grown and this needs to be taken into consideration when making P recommendations for canola. The soil test results for the example field in Figure 2 are showing soil P levels down to 8 ppm. According to this recommendation chart and the yield goal, it would need to be 40-45 lbs of actual P2O5 just to maintain this soil test level; however, applying higher rates to build the soil P level is a good idea.
Table 3. Phosphorus fertilizer recommendation guide from Agvise Laboratories.
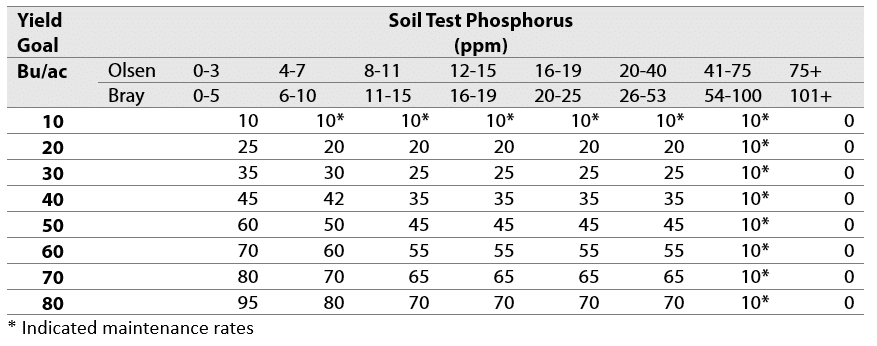
Figure 2 shows an example VR report of the N & P recommendations for the example field. As you can see, the fertility rates do vary significantly depending on zones, soil test data and the overall crop demand.
Variable rate vs. Flat Rate Applications
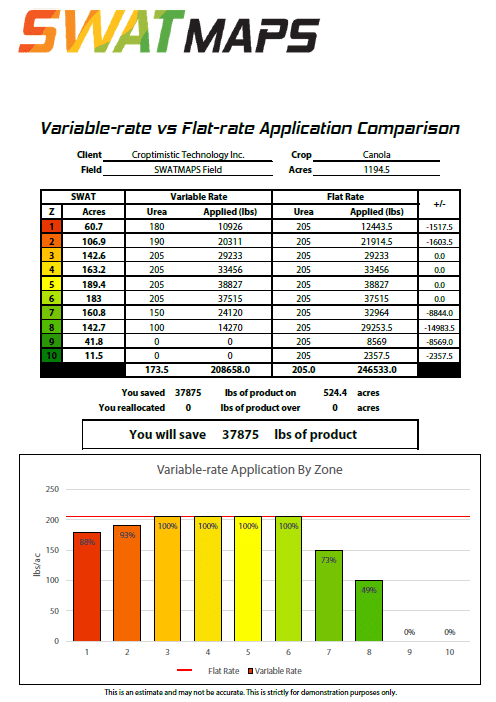
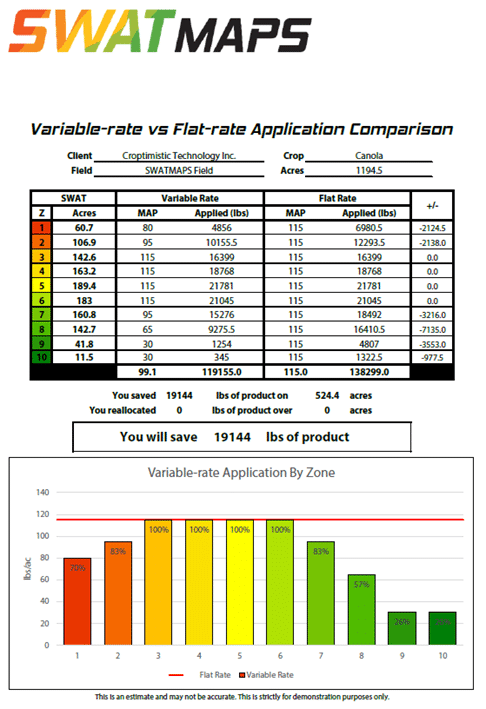
You might be wondering how variable rate will give you the best ROI on your inputs and possibly save you some money. The soil test results from Table 1 and Table 2 would result in very different fertilizer applications. A recommendation based on the composite soil test would result in high application rates being applied to the whole field. The zone-based soil test is telling a different story, where there is opportunity to rely on residual N and P levels to supply the crop with part of the fertility demand along with accounting for yield limiting factors like the salinity in Zones 7-10. In Figures 3 and 4, variable rate vs flat rate urea comparison shows how effective SWAT MAPS can be at saving product from over application in areas of the field that don't need the extra fertility.
Conclusion
Composite soil testing is a good start when making fertilizer recommendations; however, this sampling method misses important details within areas of a field like nutrient levels, pH differences, salinity, organic matter, etc. Zone-based soil sampling and SWAT MAPS Variable Rate is the most effective way to capture all the variability within a field. In the variable rate vs. flat rate example, the grower would save 37,875 lbs of urea and 19,144 lbs of MAP just by using SWAT MAPS on this field. That is a large amount of product saved and can result in product reallocated to other fields or saved money that can be invested into other areas on the farm. Talk to your SWAT MAPS service provider about how they can help you get the best return on your crop inputs and save money with SWAT MAPS Variable Rate.

Become a SWAT News insider!
Sign Me Up!
Join Our Mailing List
Enter your email below to sign up for our mailing list.
We care about the protection of your data. We’ll never share your details.
Croptimistic Technology Inc. is an international agriculture technology (AgTech) company. We began operating in 2018. Croptimistic is supported by a growing team of professionals who have dedicated their careers to developing the best soil mapping software and hardware in the world.
Copyright Croptimistic Technology Inc. © 2024 All Rights Reserved.
Privacy Policy
