Groundtruthing to select the correct SWAT MAP: What about peat?

A SWAT MAP is a map that sets the framework for a field’s soil potential and therefore management plan. This management could be for any or a combination of fertility, seed, or soil applied herbicides. By understanding the potential of soils within a field, we can maximize them, but we need to ensure we have the right map.
The first step is mapping a field with a SWAT BOX to collect electrical conductivity, elevation, and topography data which allows the creation of maps that utilize these layers in different weightings. Depending on the soil type and geographical area, the weightings will differ. This is where the critical step of ground-truthing comes in to determine the correct layers in a SWAT MAP. A trained SWAT agronomist in the field analyzes the data layers to decide what map best represents the field.
Available data layers will also include depressions, hills, and water flow paths. The agronomist uses these layers with background imagery, soil survey information, and possibly yield data if it is available. Then soil cores down to 2 feet are taken in several areas to determine any differences in soil color or horizons. As the agronomist travels the field, stubble differences, weeds, or any regrowth can help indicate how certain areas should be zoned.
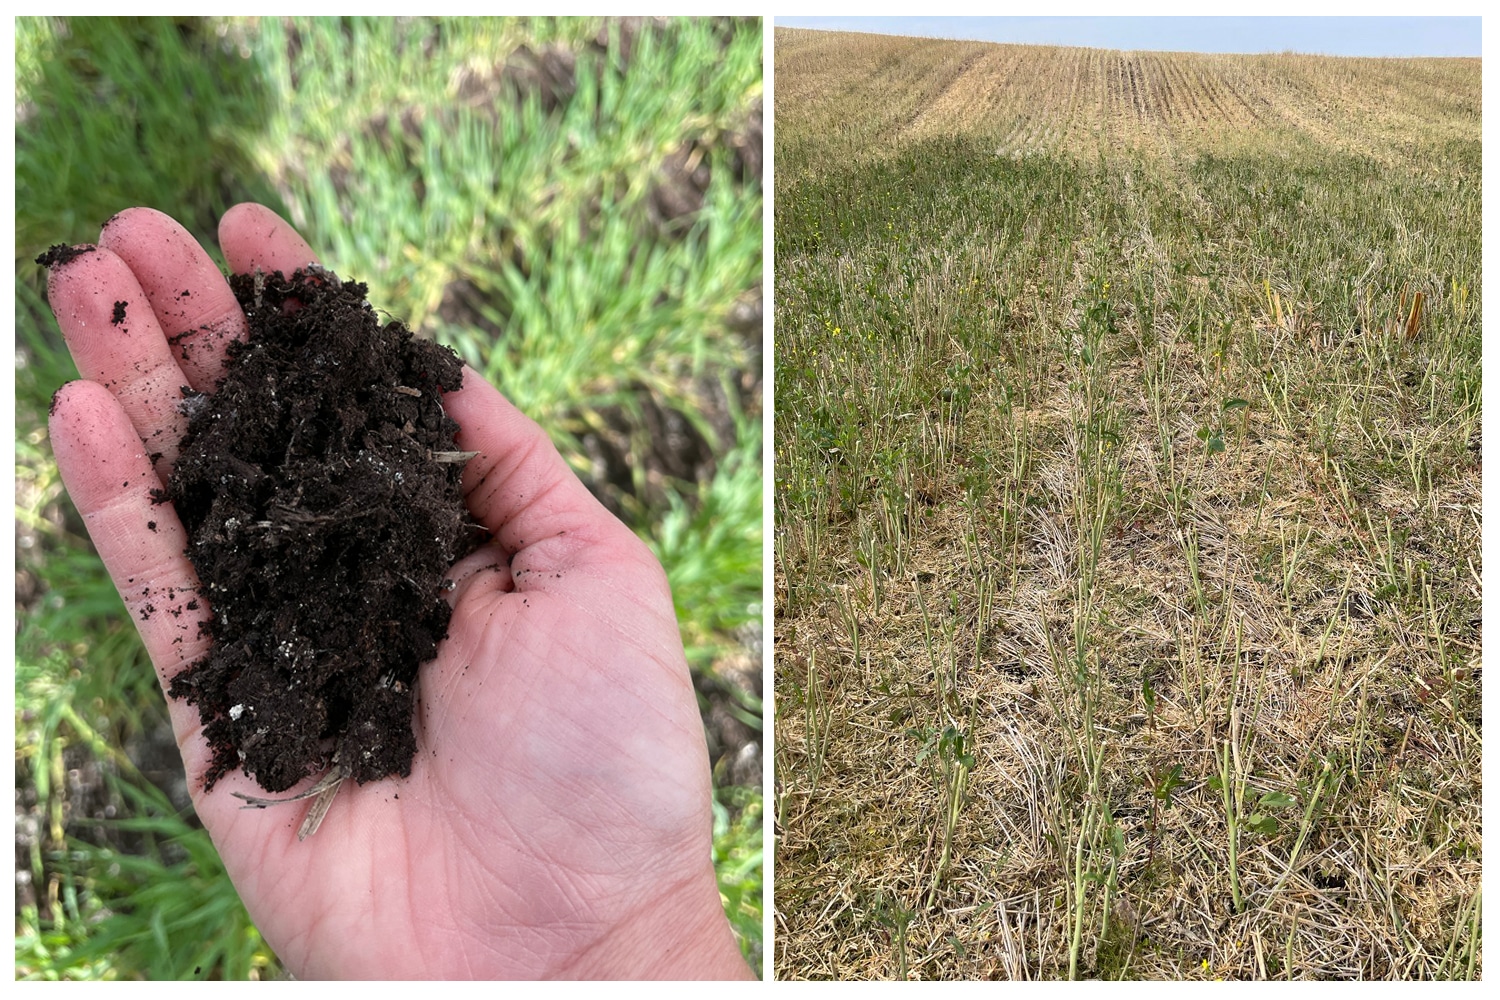
Sometimes there are unique soils that are difficult to capture in the typical data layers, and this is where being in the field, looking at the soil and stubble can help identify proper SWAT zones. One example of this is Organic order or peat soils. Because peat presents unique challenges, it needs to be managed on its own and sometimes requires a modification on the SWAT MAP to ensure it is represented well.
Peat soils can mineralize an incredible amount of N, leading to excessive vegetative growth, lodging, and delayed maturity. Here is an example of the total N that was measured in a field with peat soil in zones 9 and 10:
Table 1. Organic matter, total N, and resulting estimated pounds of organic N in 0 to 8”.
| Zones | OM (%) | Total N (%) | Total Organic N (lbs, to 8” depth) | 1% of Total N (lbs) |
| 1,2 | 4 | 0.231 | 6,160 | 62 |
| 3,4 | 4.6 | 0.275 | 7,333 | 73 |
| 5,6 | 6.9 | 0.325 | 8,667 | 87 |
| 7,8 | 9.9 | 0.443 | 11,813 | 118 |
| 9,10 | 27.1 | 0.959 | 25,573 | 256 |
In this example, if only 1% of the total N is mineralized, zone 10 would potentially have 256lbs of N become available!
The mineralization potential is impacted by organic matter as well as moisture (Schoenau, 1995). Peat soil in a field will often correlate with lower landscape position where water tends to collect and have increased mineralization potential due to moisture availability.
Organic matter binds copper more tightly than any other micronutrient (The Fertilizer Institute), so copper deficiencies occur more often here, and the critical levels used are higher than in mineral soils.
Manganese, while not often tested in a routine soil test, is another micronutrient that can be unavailable in peat soils as it becomes oxygenated and is in an unavailable form. Oats are more susceptible to this deficiency, and this has been seen in northern Alberta, where these soils are found fairly frequently.
Table 2. SWAT Zones and correlating organic matter and Mn tissue test results in oats, N Alberta.
| Zones | OM | Tissue test Mn |
| 1,2 | 5.5 | 109 (high) |
| 5,6 | 7.1 | 57 (sufficient) |
| 9,10 | 64.0 | 9 (low) |
Another characteristic that differs with managing peat is the ideal pH. While in mineral soils we don’t want to see a pH lower than 5.5 , and will adjust with amendments such as lime to target higher than this, in organic soils we don’t want to adjust higher than 5.5 or nutrient availability issues will arise (UMN Extension, 2023).
Here is an example of a field that had an area with peat that needed to be isolated. Prior to mapping, there happened to be oats on this field which are relatively tolerant to low pH. It was also a dry season, so low lying peat depressions were rather dry. This meant stubble was consistent across the field. Driving across the field, the peat was evident, and soil cores revealed areas with different peat profiles. Zones 7-8 had only about 6 inches of peat on top, whereas zone 10 had close to 18 inches of peat. Topography and depression layers also helped to segregate these areas. Background imagery from previously wet years was also helpful to find the edges of impacted areas for zoning.

Figure 1. EC Layer

Figure 2. Original SWAT MAP

Figure 3. Modified SWAT MAP to improve management areas

Figure 4. Soil test results from 0-8" and 8-16", NE Alberta
This example shows the importance of all the steps that go into creating the best possible SWAT MAP, and the map accuracy is confirmed by the soil test results, where there are drastic differences between zones.
Peat can differ in depth, how well it's drained, and its mineralization potential but in all cases, needs to be managed independently.
All the data layers collected while mapping and compiled in SWAT MAP creation are invaluable to the framework of selecting the appropriate SWAT MAP. Being in the field and looking at all variables is a critical step to ensure we have the most detailed map possible to base sound recommendations from.
References
J.J.Schoenau, Department of Soil Science, University of Saskatchewan. Understanding the Role of Mineralization in Supply of Plant Available Nitrogen, 1995.
The Fertilizer Institute. (n.d.). Essential Elements; Copper. https://www.tfi.org/sites/default/files/tfi-copper.pdf
The Fertilizer Institute. (n.d.). Essential Elements; Manganese. https://www.tfi.org/sites/default/files/tfi-manganese.pdf
(n.d.). University of Minnesota; Liming. https://extension.umn.edu/nutrient-management/liming


