


Building Soil P Levels
Wednesday, March 20, 2024 9:52 AM
Reading Time: 6 minutes
Hana Ruf
Regional Manager, East Central SK
hana@swatmaps.com
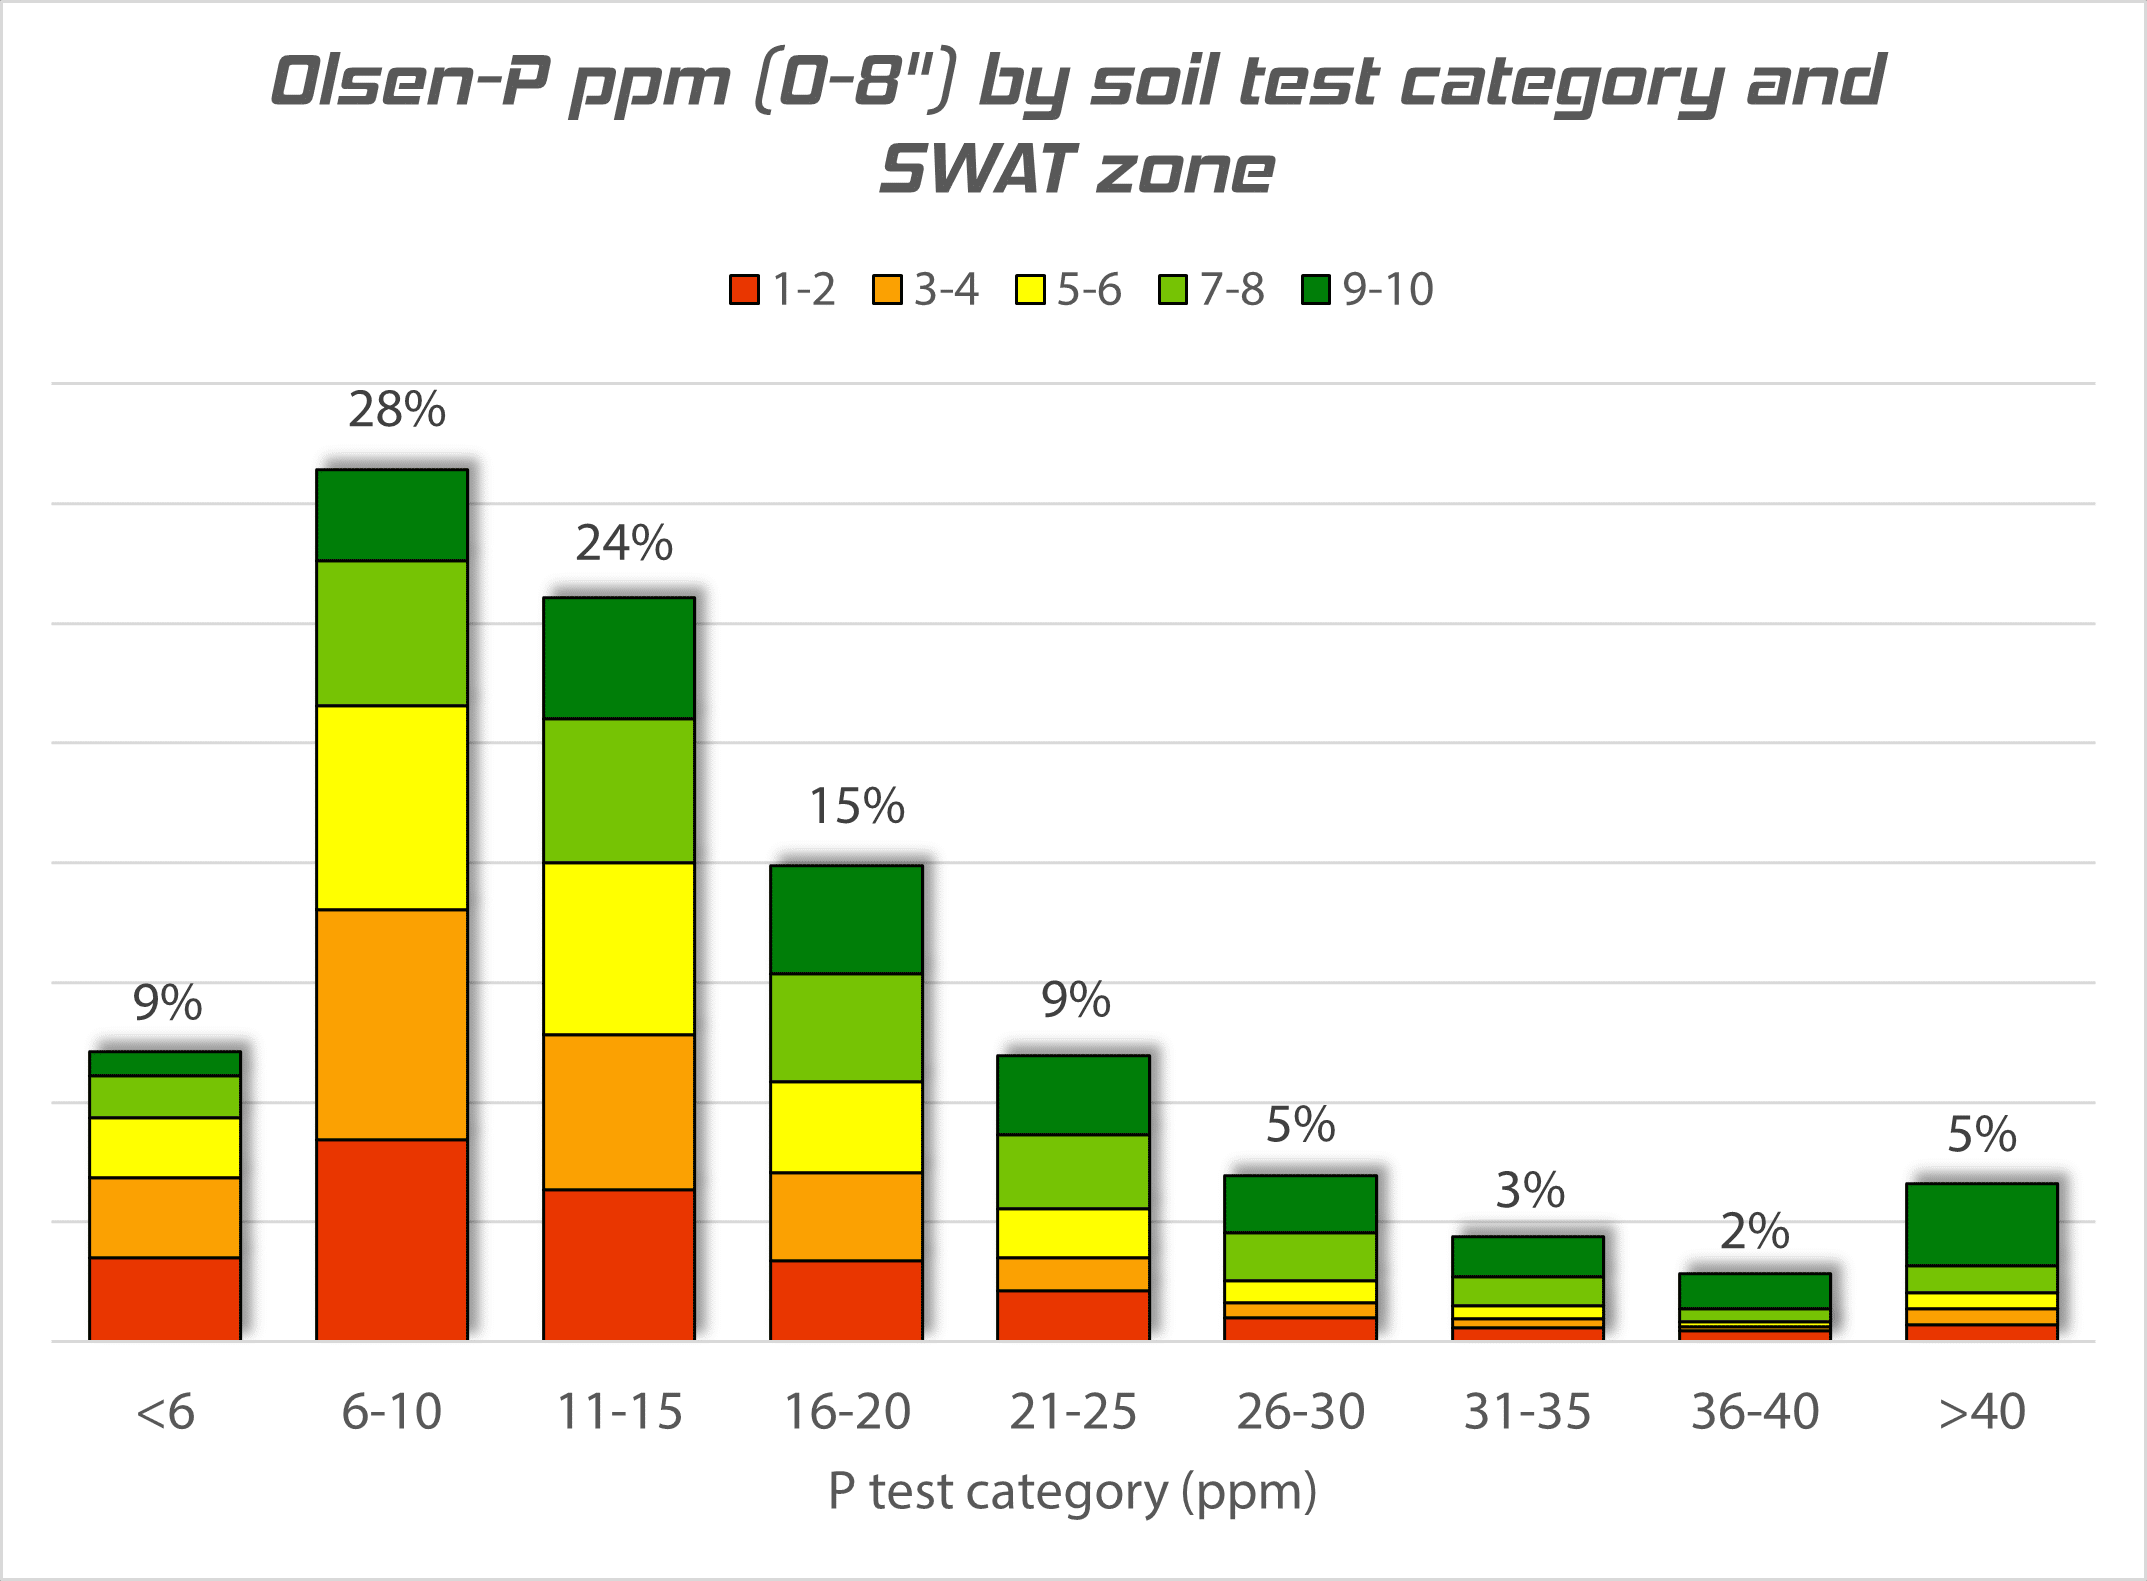
Producers in Western Canada may be leaving yield on the table by not addressing low phosphorous soil levels. Many fields in Western Canada are low in soil phosphorus levels (below 15 to 20 ppm). Phosphorous removal rates not being replaced is one of the reasons for this. Through years of testing with SWAT Zones, general trends within a field landscape have been identified. In 2023, 75% of SWAT MAP zones tested for phosphorous were below 20 ppm (Figure 1).
Current P Levels in Western Canada

Figure 1. Olsen-P ppm (0-8”) by soil test category and SWAT zone taken from all SWAT MAP fields, fall 2023.
Phosphorus variability is driven by erosion — moving downslope with soil — as well as crop removal. A field’s history often determines the trend, but typically zones 9-10 (lowest, wettest, most saline areas) are highest in P and zones 1-2 (highest, driest areas) are lowest, such as inFigure 2. A common outlier for this trend is when there is minimal historical erosion and P removal in zones 1-2, causing P levels to be higher in zones 1-2 and lower in zones 3-6 where P removal has been high over the years such as in the Dark Grey and Grey Soil Zones in Figure 2.
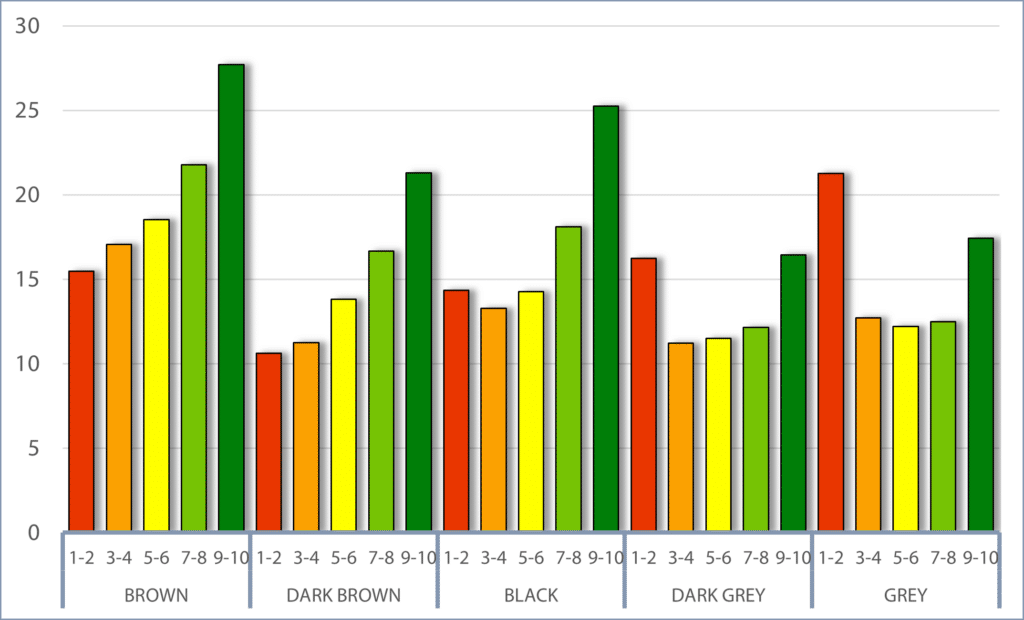
Figure 2. Soil test P levels (0-8”) by SWAT zone and Soil Zone from Saskatchewan, Manitoba, and Alberta fall 2023.
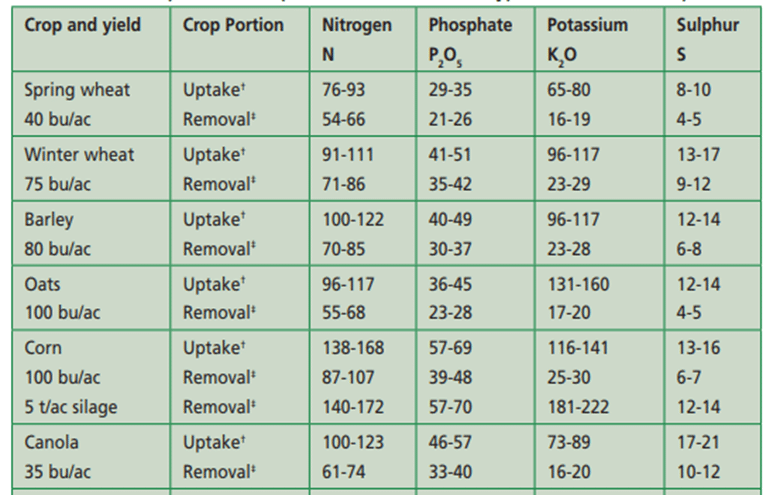
Approximately 40 to 60 lbs P2O5 are removed annually in a canola-wheat rotation (Table 1). If what is applied annually is being removed in the same year, P is mined from the soil. This is why we see so many fields with overall low P levels that have had annual high yields being removed. If a canola crop yields 55 bu/ac and 35 lb/ac P2O5 was applied, the crop is mining about 8 lb/ac of P2O5 from the soil. Repeated over many years, the soil is left with low P levels despite having good yields in previous years. Eventually, yields will start to decline as a result.
Table 1. Field crop nutrient uptake an removal. Manitoba Soil Fertility Guide, 2007.
How much yield is being left on the table?
A three-year study was conducted by the University of Minnesota comparing corn and soybean response to annual applied P in low (4 to7 ppm) and high (15 to 20 ppm) available P soils. Trials were done with rates of 0 lbs/ac P2O5, 25 lbs/ac P2O5, and 50 lbs/ac P2O5. Corn and soybean responded well to both applied fertilizer rates on the low testing P soils, with the best response from the higher P2O5 rate. There was no significant response to P on the high P soil but overall, it had higher yield compared to the applied rates on the low available P soils, and the gap was significant. The corn yield for the high P soil where 0 lbs/ac P was applied yielded 25 bu/ac more than the highest yielding corn on the low P soil. This is not to say you would want to apply zero rates when soil levels are at 15 to 20 ppm as the crop would then be drawing from those levels. Instead, you would want to apply maintenance rates by meeting the removal rates for each year’s crop.
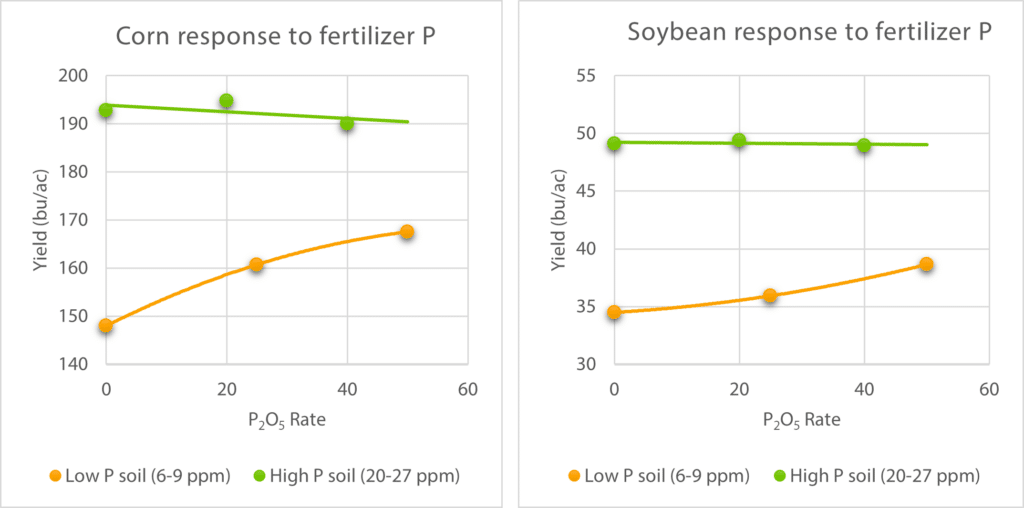
Figure 3. Results from a 3-year study at University of Minnesota on corn and soybean response to annual fertilizer rates on low P soil and high P soil.
Adam Gurr with Agritruth Research Inc. near Brandon, MB has done extensive research demonstrating the benefits of building soil P. A trial has been conducted every year since 2018 to evaluate the immediate and long-term benefits of building soil P with a big one-time application of 11-52-0 (MAP). The trial application rates are a standard check (0 lbs/ac MAP), 700 lbs/ac MAP, 350 lbs/ac MAP, and variable rate (VR) MAP at an average of 260 lbs/ac MAP) and replicated four times. This past year in 2023 the crop was wheat. The standard (0 lbs/ac) trial yielded 118.6 bu/ac, the 350 lbs/ac trial yielded 124.9 bu/ac, the 700 lbs/ac trial yielded 125.5 bu/ac, and the VR MAP trial yielded 127.5 lbs/ac.
The most impressive aspect of these trials is the long-term ROI for the VR applied MAP due to the reduction in cost. Most years it compared in yield to the 350 lbs/ac MAP and 700 lbs/ac MAP, but less MAP was needed to achieve those results.
Table 2. Long-term effects of high P build from 2018-2023 done by Agritruth Research Inc. in Manitoba.
| Crop | Year | standard | 700lbs | 350lbs | VR MAP | LSD | CV | |
| Wheat | 2018 | Yield (bus/ac) | 85.1 (C) | 103.8 (A) | 98.7 (B) | 95.5 (B) | 5.0 | 4.0 |
| Protein (%) | 13.2 (A) | 12.7 (B) | 13 (AB) | 12.8 (B) | 0.4 | 2.3 | ||
| Canola | 2019 | Yield (bus/ac) | 60.7 (B) | 64.8 (A) | 63.6 (AB) | 64.6 (A) | 3.3 | 4.1 |
| Wheat | 2020 | Yield (bus/ac) | 59.5 (B) | 62.1 (A) | 60.9 (AB) | 61.3 (A) | 1.6 | 2.0 |
| Protein (%) | 15.2 (A) | 14.6 (C) | 14.9 (B) | 15 (AB) | 0.3 | 1.4 | ||
| canola | 2021 | Yield (bus/ac) | 48.2 (B) | 51.9 (A) | 50.7 (A) | 50.5 (B) | 2.4 | 3.6 |
| soybeans | 2022 | Yield (bus/ac) | 61.1 (AB) | 62.8 (A) | 60.6 (B) | 62.3 (AB) | 1.6 | 2.0 |
| wheat | 2023 | Yield (bus/ac) | 118.6(B) | 125.5 (A) | 124.9 (A) | 127.5 (A) | 4.3 | 2.7 |
| Protein (%) | 13.3 (A) | 13.0 (B) | 13.1 (B) | 13.0 (B) | 0.2 | 1.4 |
Table 3. Long-term ROI after one-time P builds in 2018. Agritruth Research Inc., Manitoba.
| standard | 700lbs | 350lbs | VR MAP | |
| Total lbs of P applied | 0 | 364 | 182 | 140 |
| Total revenue | $4,979.00 | $5,320.97 | $5,203.05 | $5,249.06 |
| revenue difference to standard | $0.00 | $341.97 | $224.05 | $270.06 |
| cost of treatment | $0.00 | $172.43 | $86.21 | $66.31 |
| 6 year ROI | 0 | 198% | 260% | 407% |
The reason the VR applied P build works best? A look back at Figure 2 can show the answer. Typically, there are zones in a field that already have adequate to high P levels. Since other zones in the field may be very low in P and require 200+ lbs/ac, it would not be economical to flat rate these rates across the entire field and apply it in zones requiring less or no P due to high soil P levels. We especially do not want to overapply in areas where there is high salinity and low yield potential as we would be wasting a significant amount of money in those zones. Using VR to apply these high P rates usually results in the highest yields in these trials because we can be precise about putting the right amount of product in the right places within the field. Not only is this a more economical approach, but it’s also an environmentally conscious approach as well.
In a 3-year study done by Northeast Agriculture Research Foundation (NARF) in northern Saskatchewan, a high P build trial was done using SWAT MAPS variable rate. Soil P ranged from 4-5 ppm in zones 1-6 to 19-29 ppm in zones 7-10. Results can be seen in Table 4 below.
Table 4. Results from a 3-year P build study using SWAT MAPS.
| Field | Treatment | Year | Crop | P Build Grain Yield (bu/ac) | No P Build Grain Yield (bu/ac) |
| 1 | 200 lb/ac MAP, applied in 4 strips | 2013 | Wheat | 43.6 | 41.2 |
| 2014 | Canola | 54.6 | 51.9 | ||
| 2 | 150 lb/ac MAP, applied in 2 strips | 2013 | Canola | Nd | Nd |
| 2014 | Fababean | 59.5 | 52.0 | ||
| 3 | 300 lb/ac MAP, applied in 1 strip | 2013 | Canola | 46.6 | 42.0 |
| 2014 | Barley | 91.2 | 83.9 | ||
| 2015 | Canola | 65.9 | 59.9 |
The results of this study show an increase in yield in subsequent years after applying the high rate phos build. After the soil P levels are brought up to 15 to-20 ppm, if maintenance application rates are being met, this should continue to be the case.
How to Build Soil P
Approximately 20 lbs/ac P2O5 is needed to increase soil test P by 1 ppm. This means you would need to apply 70 lb/ac P2O5 for a 50 bu/ac canola crop just to increase the soil P by 1 ppm. However, most soils need a lot more than this. The most economical and efficient way to build soil P is to pick a field or a few fields each year to do a big, one-time build to get the levels up to 15 to20 ppm. After that, apply maintenance rates. If very high rates are needed, split the application over a two-year period to spread out costs. However, to do an overall increase over an entire farm likely is less feasible as it will require handling a lot more P at seeding time and will be a much slower increase, so the return isn’t as quick. The lower the soil P levels, the more crops will respond to applying high enough rates to get levels up to 15 to 20 ppm, as shown in Figure 4.
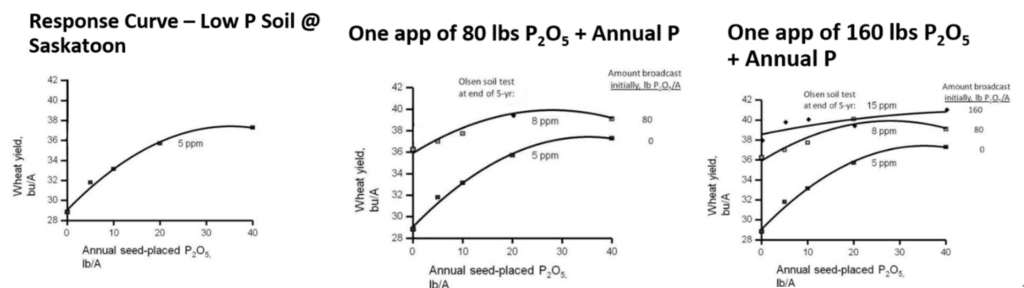
Figure 4. Response to annual seed placed P2O5 on wheat yields with various increasing soil P.
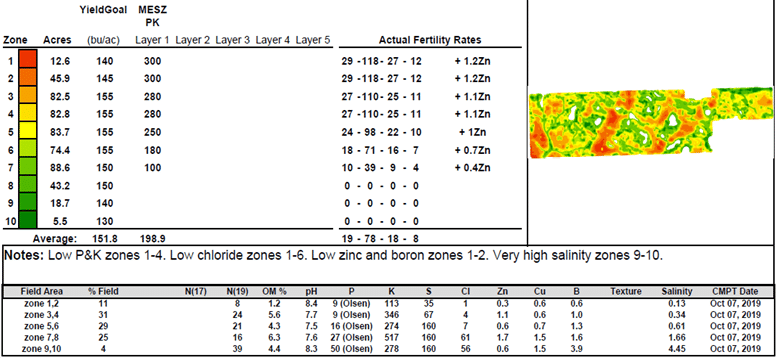
Figure 5. SWAT MAPS VR report demonstrating an applied P build using an MESZ/MAP/Potash blend.
Figure 5 shows an example of a SWAT MAPS VR report where a one-time P build was applied. In this case, a MESZ/MAP/MOP blend was applied. MESZ was added to ensure the high P levels and high soil pH do not induce a zinc deficiency in susceptible crops grown on the farm, such as corn, wheat, and barley. Straight MESZ was not used as there was a price premium and higher rates were needed to reach the overall actual P goal.
Applying these high P build rates are best if banded into the soil as deep as possible. If the phosphorous is spread on the soil surface, ensure it is incorporated with tillage immediately after application. Application timing can be done in fall or spring.
Summary
Soils with low P levels are limiting yield. Over the years, P levels have decreased on many fields due to erosion and high removal rates. Using SWAT MAPS variable rate is a cost-effective way to build soil P levels to support higher yields.
References
Gurr, A. (2019). Long-term P trial 2019. agritruth.ca.
Leikam, D., G. Randall and A. Mallarino. 2010. Are current soil test-based phosphorus and potassium recommendations adequate? Crops & Soils. Vol.43-6. Pp 27-32.
Manitoba Soil Fertility Guide. (2007). Government of Manitoba. https://www.gov.mb.ca/agriculture/crops/soil-fertility/soil-fertility-guide/pubs/soil_fertility_guide.pdf
Stewart, B. (n.d.). Revisiting Phosphorous Recommendations. Agriarm. https://agriarm.ca/wp-content/uploads/2017/01/Revisiting-Phosphorus-Recommendations-Stu-Brandt.pdf
Wager, B.I., J.W.B. Stewart, and J.L. Henry. 1986. Comparison of single large broadcast and small annual seed-placed phosphorus treatments on yield and phosphorus and zinc contents of wheat on Chernozemic soils. Can J. Soil Sci. 66:237-248.

Become a SWAT News insider!
Sign Me Up!
Join Our Mailing List
Enter your email below to sign up for our mailing list.
We care about the protection of your data. We’ll never share your details.
Croptimistic Technology Inc. is an international agriculture technology (AgTech) company. We began operating in 2018. Croptimistic is supported by a growing team of professionals who have dedicated their careers to developing the best soil mapping software and hardware in the world.
Copyright Croptimistic Technology Inc. © 2024 All Rights Reserved.
Privacy Policy
