


Addressing Potassium Deficiency Using SWAT MAPS
Wednesday, September 20, 2023 7:00 AM
Reading Time: 4 minutes
Although the prairies are known for having the largest reserves of potash in the world, there are some areas with soils that have relatively low background potassium (K) levels — particularly in the black and dark grey soil zones of Canada that span northern Alberta, Saskatchewan and into Manitoba. In spring 2023, many of these areas are where we saw higher than normal temperatures coupled with humidity and adequate moisture. This created greenhouse-like growing conditions, making crops’ demand for nutrients high, resulting in more visual nutrient deficiencies than we might normally see, particularly K deficiency in cereal crops.
Symptoms
There are many possible symptoms of K deficiency which can make diagnosis difficult. Looking at soil tests by SWAT zone combined with a comparative tissue test are often required to confirm deficiency. Symptoms include:
- Yellowing of the oldest leaves
- Poorly developed roots
- Weak stems
- Poor water use efficiency
- Smaller seeds
- Poor N uptake
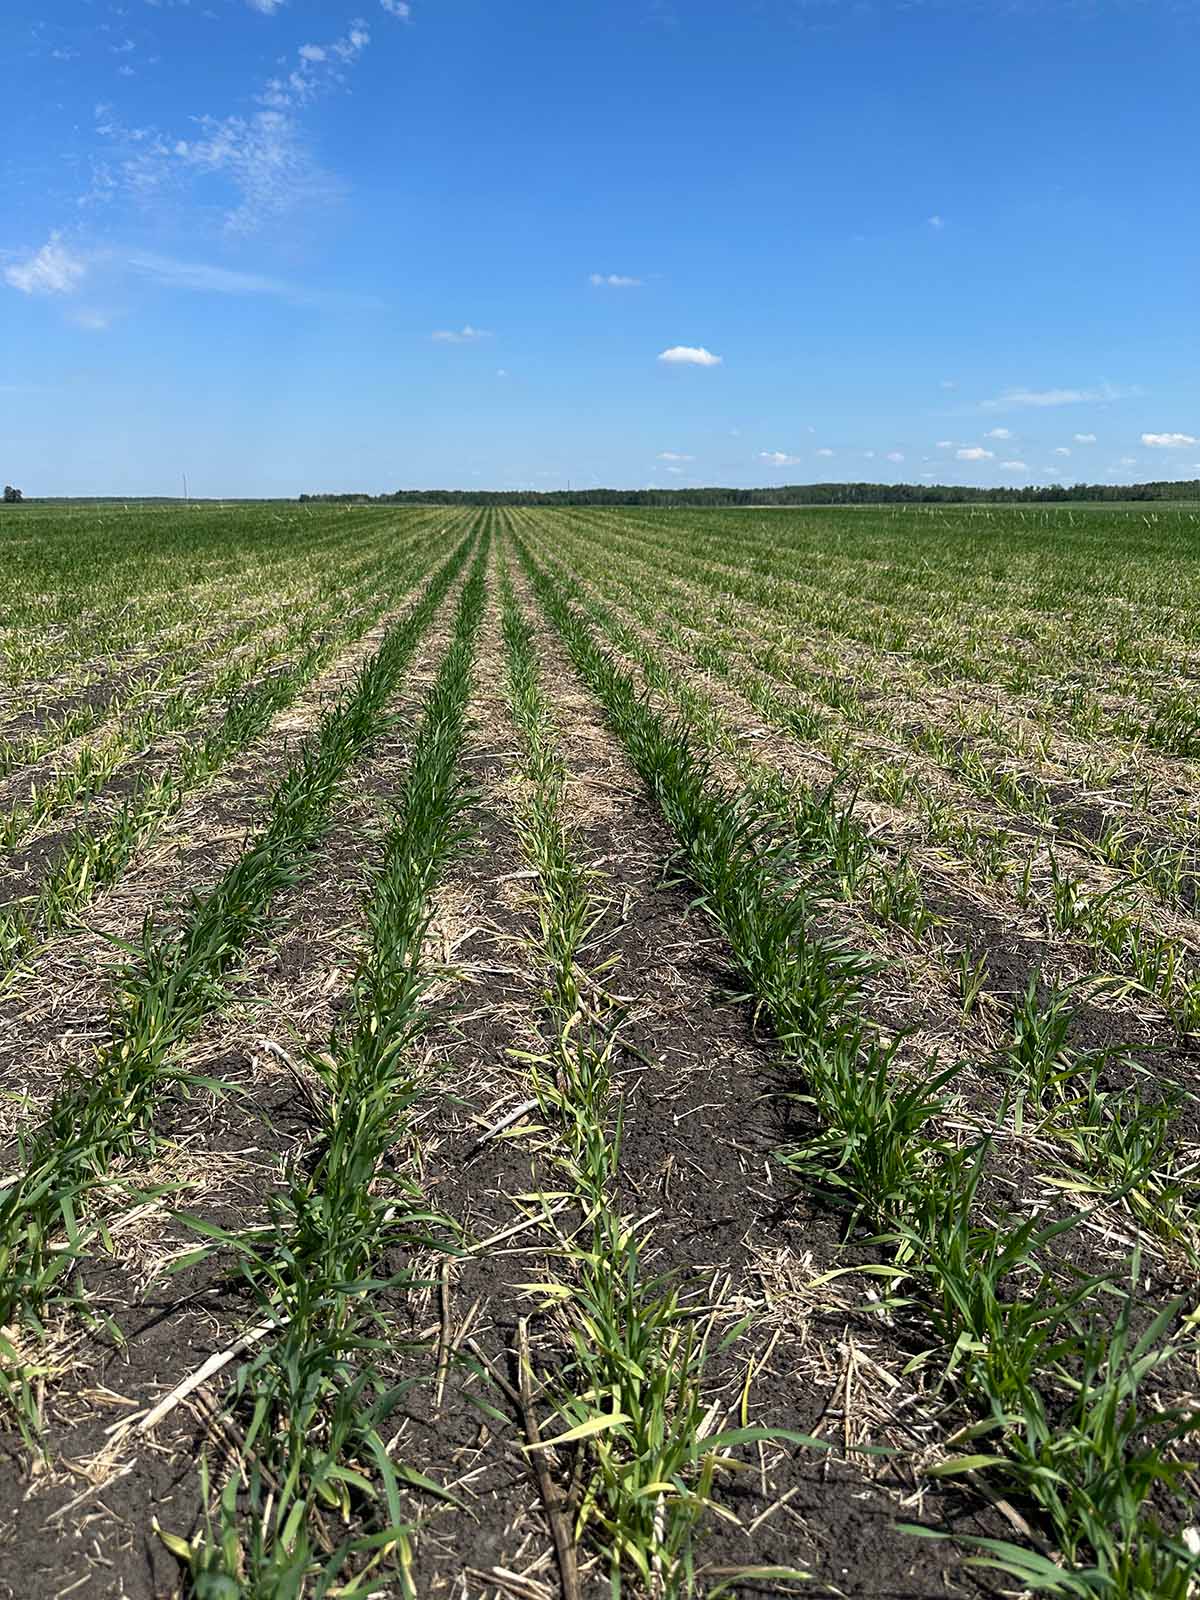
The most obvious and common deficiency symptom is yellowing of the oldest leaf that starts at the tip and progresses toward the base of the plant. These plants also tend to be stunted and have less biomass overall. Another common observation in fields displaying K deficiency is the presence of green, healthy strips where there was heavy straw or swaths —particularly in canola stubble — from previous years as K is the only nutrient that can be added directly back into the soil and is readily available by leaching through straw.
Where to look
In the higher rainfall areas of the black and dark grey soil zones, soil K distribution tends to be predictable in relation to SWAT Zones. Soil K levels tend to be lower in upper landscape positions (zones 1-4) and higher in lower landscape positions (zones 7-10). SWAT Zones 1-4 generally have lighter soil texture and are water shedding, which allows for the movement of K down-slope. Potassium levels can also be correlated with soil texture, where higher clay content and cation exchange capacity means more K is held to soil particles and is less prone to leaching. These are soil characteristics more often seen in SWAT Zones 7-10. Given the generally higher annual rainfall in these regions, in many instances yields might be highest in zones 1-4 resulting in the greatest rates of nutrient removal.
Table 1. K trend by SWAT zone in the grey soil zone of NE SK.
| Field Area | N | OM % | pH | P (Olsen-P) | K | S | Cl | Salinity |
| Zone 1,2 | 13 | 2.6 | 7.2 | 17 | 107 | 27 | 5 | 0.12 |
| Zone 3,4 | 16 | 4.4 | 6.7 | 8 | 146 | 45 | 12 | 0.23 |
| Zone 5,6 | 21 | 6.3 | 7.7 | 10 | 156 | 45 | 8 | 0.26 |
| Zone 7,8 | 32 | 6.3 | 7.6 | 16 | 230 | 45 | 24 | 0.34 |
| Zone 9,10 | 33 | 8.6 | 7.2 | 19 | 252 | 160 | 21 | 1.01 |
K Stratification
Nutrient stratification is a naturally occurring process. Roots take up moisture and nutrients from below the soil surface and relocate them to above ground plant tissue to then be laid back on the soil surface when the plant’s life cycle is over. This process continues to happen in agriculture but is accentuated by some farming practices. Minimum or no-till fertilizer practices typically result in fertilizer being placed somewhere in the top 0-2” of the soil surface; however, plants are taking up nutrients throughout the soil profile which are returned to the soil surface in the form of straw. So, with relatively immobile nutrients such as phosphorus (P) and K, these nutrients continue to become very stratified in the top couple inches of soil (Table 2). Broadcast applications of P and K further accentuate this occurrence.
Table 2. Soil test P and K at varying depths and from a 0 to 8” test depth, from the Black Soil Zone of Saskatchewan.
| Soil Test Depth | P (Olsen-P, ppm) | K (ppm) |
| 0-2” | 16 | 299 |
| 2-4” | 6 | 178 |
| 4-8” | 2 | 159 |
| 0-8” | 5 | 248 |
In Figure 1, deficiency symptoms seemed to skip several seed rows in this field. This is the result of a few openers of the drill seeding shallower and seedlings accessing K that was likely stratified from previous years’ broadcast potash applications and from long-term no-till farming practices. K deficiency was confirmed through tissue testing healthy versus unhealthy rows of plants.
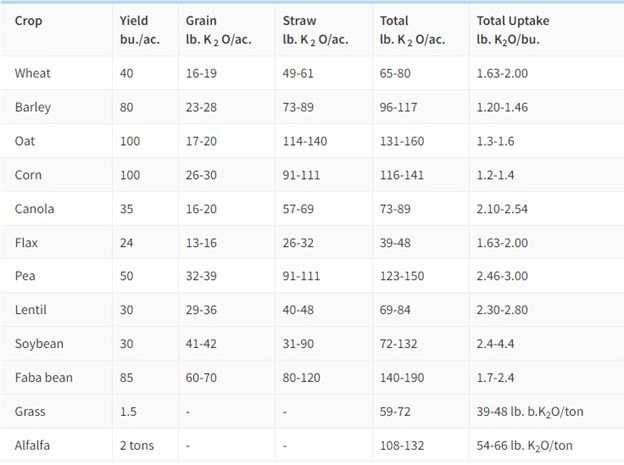
K Uptake and Removal by Crop Type
K requirements vary substantially based on crop type, (Table 3). Although some of the crop types listed below have high requirements for K such as peas and fava beans. Barley seems to be the most sensitive to K deficient soils and the crop type we see deficiency symptoms in the most often.
Opportunities for Management with SWAT MAPS.
Understanding K allocation within your fields using SWAT MAPS allows for more precise management. SWAT MAPS allows you to take your existing fertilizer budget and allocate nutrients like K to areas that need it the most. That could be areas of the field that are testing deficient or areas of the field where you are most likely to see a response based on the soil properties mentioned above. ROI on applied potassium can be improved using SWAT MAPS, especially if doing applications in large quantities to build soil test levels.
References
The need for potassium. (n.d.). Potassium fertilization in crop production. https://www.saskatchewan.ca/business/agriculture-natural-resources-and-industry/agribusiness-farmers-and-ranchers/crops-and-irrigation/soils-fertility-and-nutrients/potassium-fertilization-in-crop-pro
Ethan Rheaume
Precision Agronomist
Become a SWAT News insider!
Sign Me Up!
Join Our Mailing List
Enter your email below to sign up for our mailing list.
We care about the protection of your data. We’ll never share your details.
Croptimistic Technology Inc. is an international agriculture technology (AgTech) company. We began operating in 2018. Croptimistic is supported by a growing team of professionals who have dedicated their careers to developing the best soil mapping software and hardware in the world.
Copyright Croptimistic Technology Inc. © 2024 All Rights Reserved.
Privacy Policy
