Understanding Terms Used to Discuss Soil Moisture Variability

Introduction
Water is the physical mechanism by which plants take up nutrients. Water is the mechanism through which nutrients are extracted from the soil and relocated to where the plant needs it most – roots, stalk, leaf, flower, and seed. Once present, water becomes the way in which roots can extend to access more moisture and additional nutrients found deeper in the soil. It is a balancing act of right moisture conditions resulting in optimum growth, deeper roots, more moisture – and the cycle continues. Considering the importance of water and the increase in short- and medium-term droughts in agriculture – what can growers do to manage effectively for soil moisture variability? Better understand your soil moisture variability across your field and through the season.

Soil Moisture Definitions
Volumetric moisture content, available water, plant available water, soil texture, permanent wilting point, temporary wilting point as well as a host of units mm, mm/m, %, mm/unit depth etc. are all terms that can become quite overwhelming.
In the development of SWAT WATER, a product of SWAT MAPS, the objective has been to provide three relatively simply datasets for users to interpret and drive management decisions e.g., how can my variable rate fertilizer application be adjusted to account for soil moisture variability. Volumetric Moisture Content (VMC), Plant Available Water (PAW) and Days until Wilting Point were developed to provide SWAT WATER users with an indication of when and where a crop is going to show moisture related stress.
Volumetric Moisture Content (VMC)
The Manitoba Department of Agriculture uses a fantastic “gas tank” analogy to describe soil moisture. In simple terms how much fuel is stored in your gas tank right now, is a very simple way to understand soil moisture.
- Saturation – your tank is overflowing.
- Field Capacity – your tank is full; add anymore fuel and it will overflow.
- Temporary Wilting Point – your fuel warning light is on.
- Permanent Wilting Point – Your tank is empty.
In simple terms volumetric moisture content (VMC) is the level of your gas tank right now. This could be any one of the levels described above or somewhere in-between, which is normally the case.
Plant Available Water (PAW)
For agricultural crops, the volume of water that is of most importance is the moisture that the crop can access and use. Using the fuel tank analogy, if you were to put a sponge into your fuel tank, your car would only be able to use the fuel that is liquid. Once the tank is empty, any fuel absorbed by the sponge cannot be used by your car.
- Available Water – In simple terms this would be the current level of fuel in your tank, less the amount of fuel that is held by the sponge and cannot be accessed by your car. In agricultural crops, this is commonly referred to as Plant Available Water (PAW). In the same way as fuel held by the sponge cannot be used by your car, soil particles hold onto some soil moisture so tightly that it cannot be accessed by the crop.
Plant Available Water, in simple terms, is the total volume of fuel in your cars tank less the amount that your car cannot access in the sponge. If you were to squeeze the sponge in your fuel tank – there would be a certain amount of fuel that would come out. In soils this point is described as the Permanent Wilting Point (PWP) i.e., there is fuel/water but because it is held under pressure by the sponge(soil) your car (crop) cannot access it. This amount of fuel/water needs to be ignored and cannot be used.
Volumetric Moisture Content (VMC) includes the amount of fuel/water held in the sponge/soil; Plant Available Water (PAW) excludes the water that the crop cannot access. As you can see – the most important dataset for crop production is Plant Available Water (PAW) as this is the moisture that drives yield or productivity.
Soil Variability (Texture)
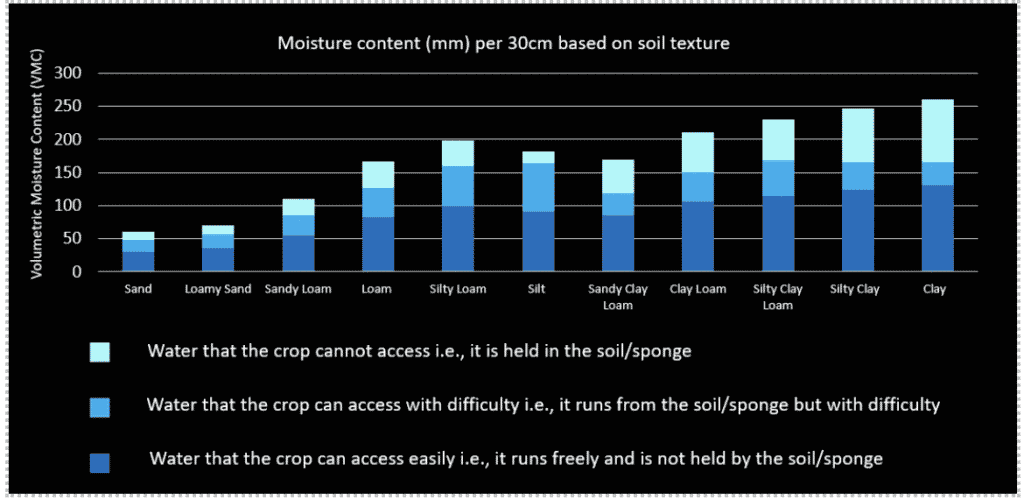
Using the gas tank analogy, soil variability affects how large the tank is, and how many sponges are in it. In simple terms, although the fuel tanks may hold the same amount of fuel, there will be more fuel withheld by the tank with five sponges then the tank with one sponge. Ultimately your soils sand, silt and clay percentage behave much like a sponge does in your fuel tank.
Sand – A high sand percentage is like having a small fuel tank but no sponges in the tank. In other words when the tank is empty there is no or very little fuel/water withheld.
Clay – A high clay percentage is like having a large fuel tank with lots of sponges in the tank. Although we all know there is fuel in the tank, because of the number of sponges there will always be a fair amount of fuel in the tank that your car/crop cannot access.

The illustration above shows how different sand silt and clay percentages affect how much water is freely available to your crop. As you can see clay soils tend to hold a large amount of water but much of this water is held in the sponge/soil and cannot be accessed by the crop. At the other end of the soil spectrum, sandy soils hold very little water even when they are overflowing or saturated. A soils sand, silt, and clay percentage acts much like a sponge or several sponges in your cars fuel tank.
Understanding Soil Moisture Variability – Why it Matters?
Applications of the SWAT MAPS variable rate technology has shown that Zone 1s, which are generally made up of coarser textured soils, tend to store less water and stress more often, while Zone 8 through 10 tend to stress more from too much water. Interestingly Zone 1s are quite frequently low on potassium (K) and almost always low on Sulphur (S), while the opposite is true for Zones 8-10. Hydrology plays a significant role on Sulphur distribution in your field. Being a mobile nutrient, water collecting areas in a field can typically have high Sulphur levels, while water shedding areas are often deficient. Drought prone parts of your field can, through variable rate applications of Sulphur, be managed to provide your crop with appropriate nutrition, sufficient to mitigate the impact of soil moisture stress.
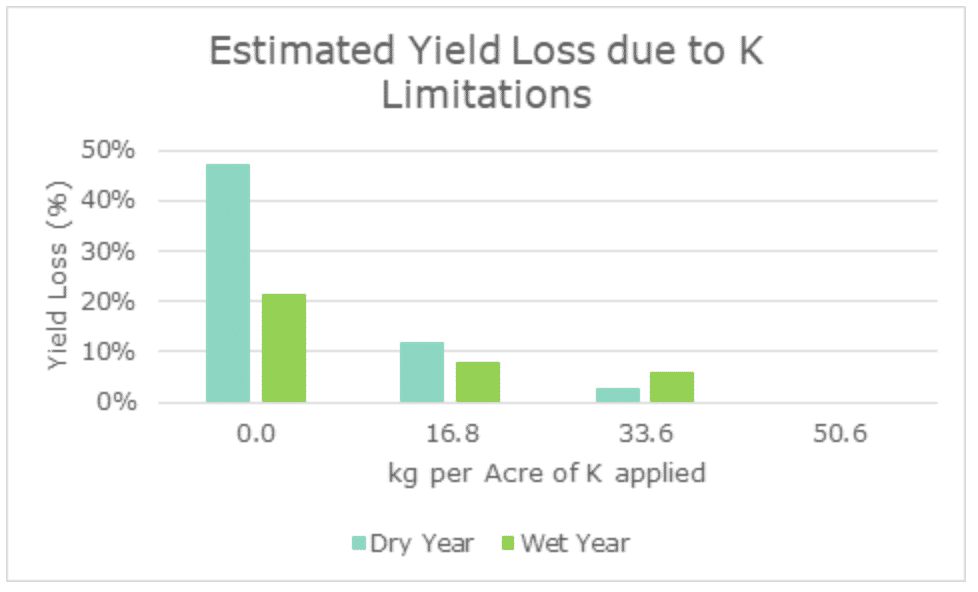
A fair amount of research suggests the importance of potassium (K) and magnesium (Mg) in reducing plant stress associated with drought in wheat. Results from European research trials in wheat, included in the chart below, which compared potassium fertilization in a wet season compared to a dry season, show a 20% to 40% yield loss difference between dry and wet years for the same soil, depending on the rate of potassium applied.
The chart below illustrates estimated yield loss due to potassium limitations in wheat trials undertaken by the Institute of Plant Nutrition – Faculty of Agricultural Sciences Goettingen.

The current research suggests that plants, not limited in potassium, can store excess carbohydrates in the stem of the plant for energy use later in the season. In the event of moisture stress, the plant can access these stem reserves to continue growth and in so doing limit the effect of moisture stress on yield. Potassium shortages have also shown shallower rooting depths which would have the effect of increasing drought stress. In a similar way Sulphur (S) has been shown to improve crop recovery after a drought event. Keeping in mind that soil moisture is quite often available at depth, but your crop needs to be given the opportunity to get its roots down into the plant available moisture.
Secondary to a fertility program that increases your crops’ ability to manage water stress and still yield appropriately is the consideration that denitrification is significantly increased in those parts of your field that are poorly drained or are wet. The SWAT MAPS process has often identified these areas to be found in areas with high clay content. In fact, the relationship between sand, silt and clay content is a significant driver of soil moisture variability and as a result should be a key consideration in any variable rate fertility program. The SWAT WATER program allows farmers to easily identify soil variability by the SWAT MAP Mapping process but secondly measure and provides tools to monitor soil moisture conditions, crop stress point and days to wilting point at 4 rooting depths. These tools provide the grower with a mechanism to apply split applications of nitrogen applications in locations that have high soil moisture content and or are poorly drained. Considering that nitrogen fertilization rates are a major economic as well as ecological consideration, applying the right rate in different parts of the field is key to reducing economic losses through overapplication and potential leaching, without compromising on yield.
Jonathan Freeman
SWAT WATER Specialist
jonathan@swatmaps.com
References
Franzen, D., & Grant, C. A. (2008). Sulphur response based on crop, source, and landscape position. Sulphur: A missing link between soils, crops, and nutrition, 50, 105-116.
Panhwar Q A, Ali A, Naher U A & Memon M Y (2019). Organic Farming – Global Perspectives and Methods. Chapter 2 – Fertilizer Management Strategies for Enhanced Nutrient Use Efficiency and Sustainable Wheat Production, 17 – 39.
Manitoba dept of Agriculture. Agriculture – Soil Management Guide, Water Use and Moisture Management. Accessed 6 July 2021 https://www.gov.mb.ca/agriculture/environment/soil-management/soil-management-guide/water-use-and-moisture-management.html
Metwally. S. Y, Pollard A. G. (1959) Journal of the Science of Food and Agriculture/ Volume 10, Issue 11. Effects of soil moisture conditions on the uptake of plant nutrients by barley and on the nutrient content of the soil solution. P 632 – 636. https://doi.org/10.1002/jsfa.2740101109


