How variable is your soil?

Grid soil sampling has historically been the gold standard to measure nutrient variability in soils. In many regions, 1 hectare or 2.5 acre grids have been a very common strategy, with not a lot of technology needed to do it. But it is time consuming and expensive. It’s A LOT of sampling. But perhaps the biggest issue is that it assumes, to some extent, that these made-up squares that are completely unrelated to topography or soil differences will be enough to capture all the true variability that exists in a field. So, is grid sampling good enough? Or can we do better with newer technology?
This is the question we at Croptimistic wanted to answer, so we picked a few fields in different regions and soils in Canada. It’s simple really – you lay out 2.5 acre grids, and then take several soil samples at different points within the grid. In our case we were curious if SWAT soil based management zones captured significant variability within the 2.5 acre grid.
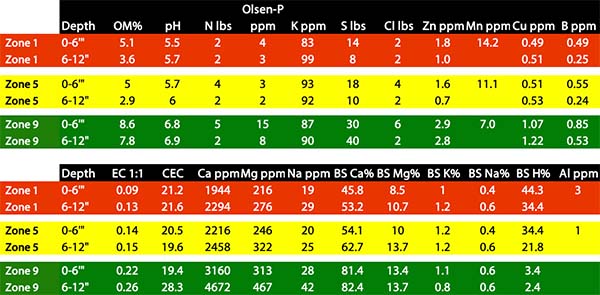
The results were very much what we expected – there can be a lot of soil and nutrient variability within a 2.5 acre square! There can also be a big difference between soil water status due to landscape position, and therefore crop yield potential. Below are field and soil test results from the University of Alberta Breton Farm, which is currently established perennial hay. The whole field is only 6 acres, so in this case the soil test points are within only 1 acre.

There is significant variability in several attributes including organic matter, pH, P, S, and most micronutrients. The trends are ones we commonly see – lower landscape positions (in this case, the zone 9 point) that collect water and eroded soil from knolls are often high in organic matter with deep top-soil (depicted in subsoil OM%) and have higher nutrient levels. The difference that doesn’t show on the soil test was soil moisture. In zone 9, the soil probe easily went in the soil to 12”, with soil moisture likely close to field capacity. In contrast, the zone 1 point took some effort to get the probe in, and the soil was already quite dry.
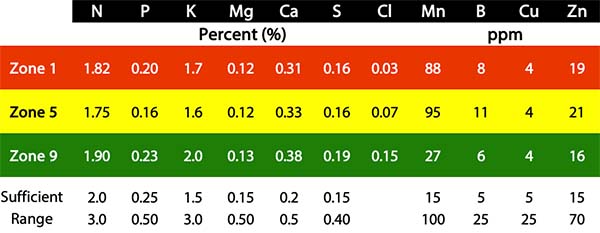
The site at Breton Farm was unique in that it was grass hay (brome) and was unfertilized. So, any variability in the brome grass was due to soil and water variability, not from historical site-specific management. For this reason, we took a tissue test at the exact same points where soil tests were taken, shortly before the brome entered the reproductive stage – typically a time of high nutrient demand for all crops. The tissue test results are shown below.

As expected based on visual observation, the grass appears to be quite nutrient deficient and would benefit from applied nitrogen and phosphorus. Several trends in the tissue results followed the soil test well – particularly N, P, Ca, S, and Cl. Tissue N and S reflect the soil’s ability to mineralize these nutrients from organic matter. Phosphorus availability is likely reflective of the extractable soil P as well as potential fixation from Al in acid soil in zones 1 and 5. Mn levels are also quite high in zones with acidic soil – something we’ve observed in canola as well in this area, to the point where Mn toxicity is causing visual symptoms on canola leaves and likely root pruning. Stunted roots then lead to poorer uptake of all nutrients, particularly relatively immobile P, Cu, and Zn. It’s a vicious cycle, and one that can only be solved with pH amendments such as lime, cement kiln dust (CKD), or wood ash.
The combination of soil and tissue data clearly demonstrate the nutrient supplying power of different soils within a small area of the field, and that these differences can be efficiently mapped and measured using modern precision ag tools. The benefits are multi-faceted – economic advantages for the farm resulting from applying the right rates in the right areas, and environmental benefits or reduced nutrient applications where they are not needed. It’s simply 4R Nutrient Stewardship in high resolution.


