Make it Count: How to Harvest Field Trials
Trials are an important part of our learning about how different treatments benefit each SWAT ZONE. Whether it is a replicated trial, a casual strip trial or a field split in half, collecting the data at harvest time is key for future decision making.
About Our Process
The SWAT MAP Yield Potential team approaches trial data differently than processing yield on a field scale. First, because we are dealing with smaller areas, we use a much higher resolution map. Then, we manually clean the raw point data to ensure the maximum amount of quality data is preserved. Data points too close to trial edges are removed to reduce the effect of any overlap between treatments. Headlands and passes around sloughs or obstacles are also removed.
Best Practices for Harvest
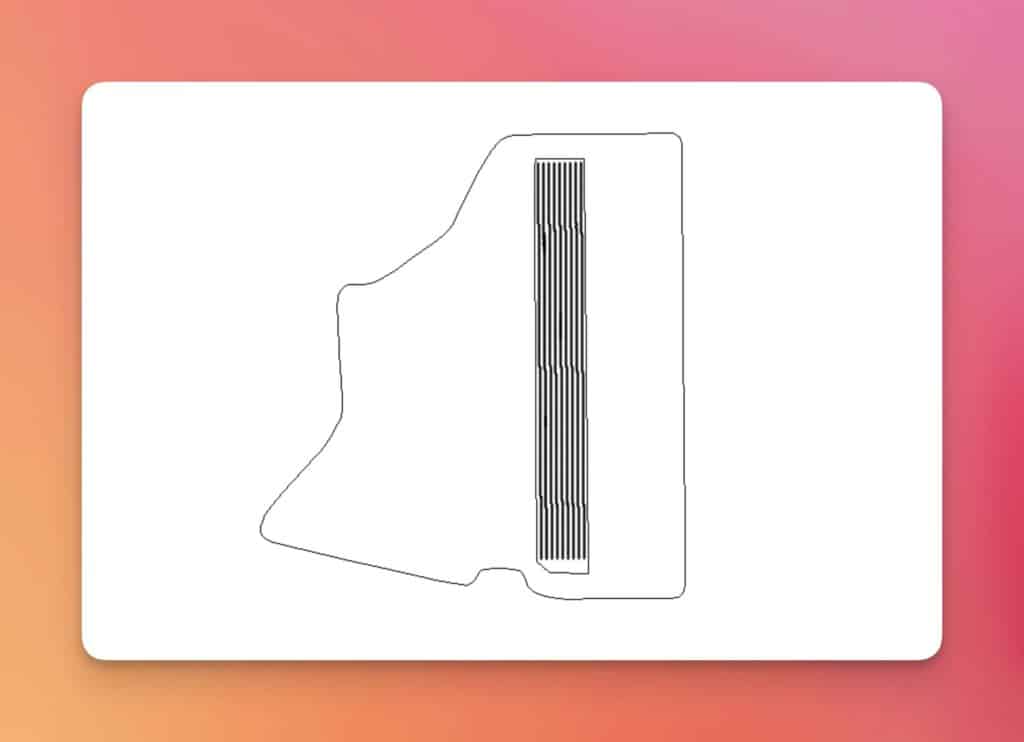
The most crucial part of harvesting trials is direction. Harvesting along the same direction as the trial strips will preserve as much of the data as possible and make those results most accurate. Because we clip the data close to trial boundaries, harvesting at 90 or 45 degree angles will reduce the usable data by 50-70%.
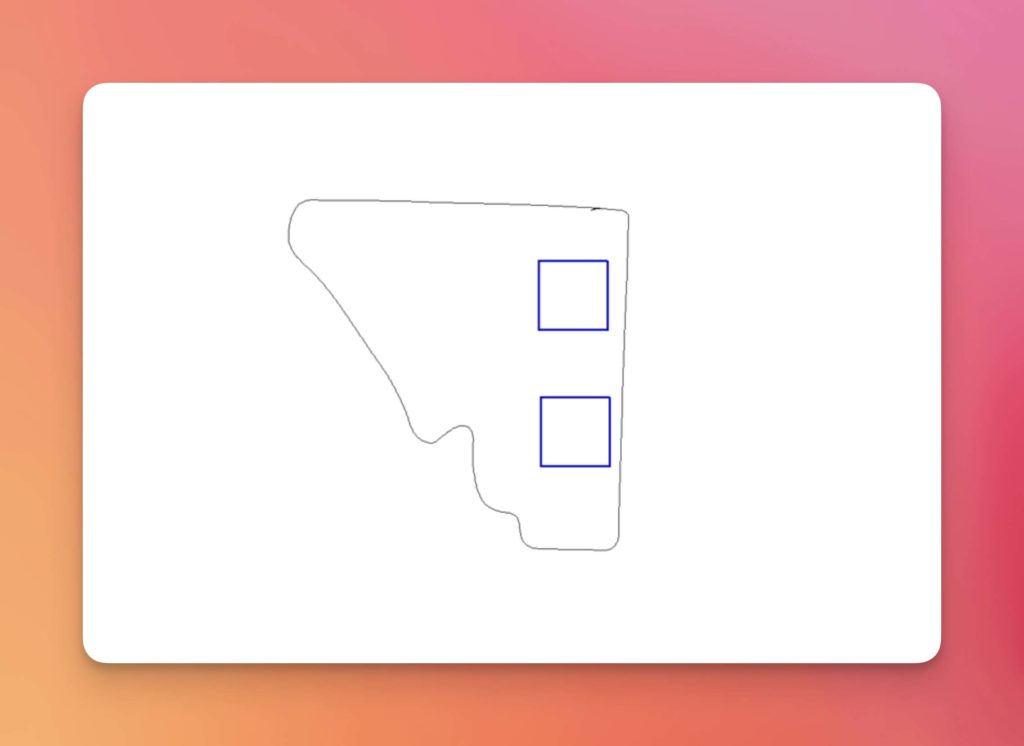
Direction is so important that our GIS team will design trial strips to match what farmers intend to do. We implement square blocks instead of strips for farms that harvest on 45 degree angles.
When possible, use the same combine to harvest the trials and a minimum of 2 surrounding passes. This way we can rule out machine discrepancies in the data and have enough data around the trial to use as a control. For large trials where a field is split in half, try to run your combines side by side so an equal area is covered by each machine in each treatment area. The same principles also apply to swathing.
Calibration
Trials often have a wide range of yields between treatments and different SWAT ZONES. To accurately capture this, it is important to calibrate your combines at different flow rates to ensure the yield monitor is reading correctly regardless of the crop conditions.
When using a weigh wagon, it is important to keep accurate, easy to understand records of the weights and what is being weighed. Also ensure the units of measurement are clear. Measuring bulk density (bushel weights) is also helpful.
Results
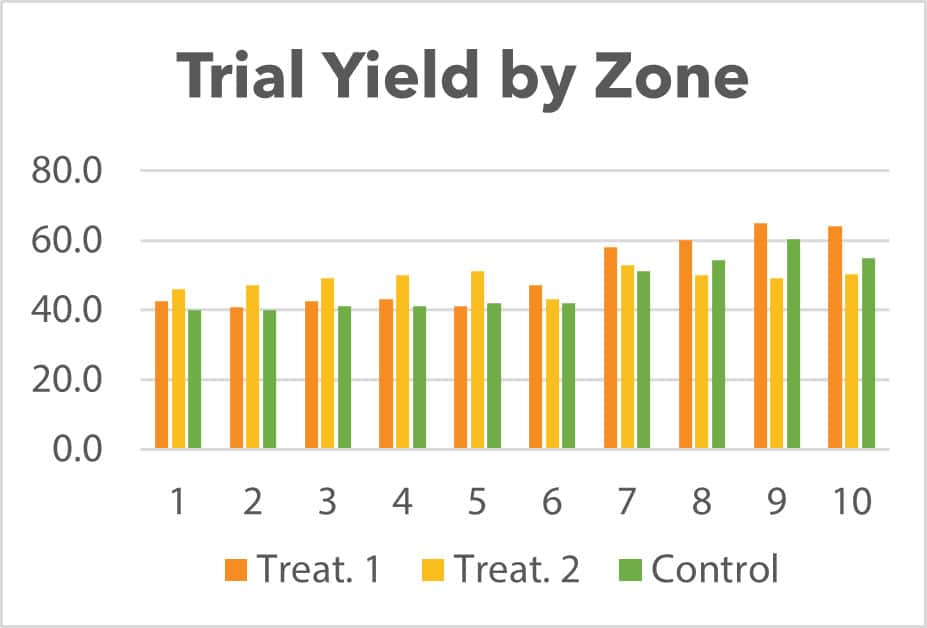
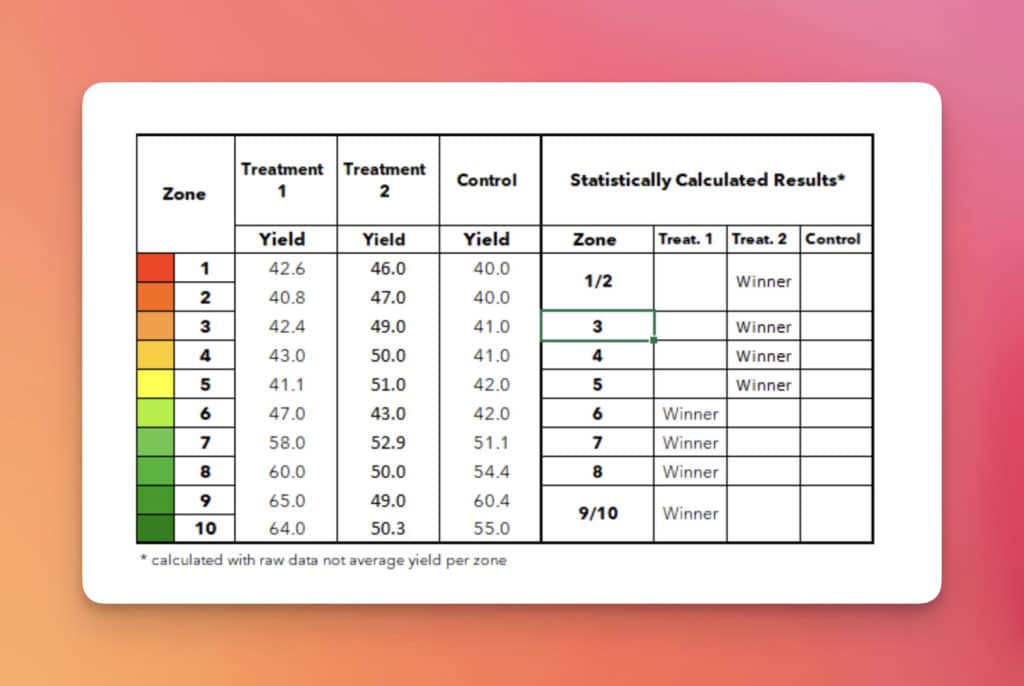
The cleaned data points are sorted by SWAT ZONE and analyzed for statistical significance. This is done by using each data point in the trial and zone area, not just by average yield. This method takes into consideration the variability that may exist in each trial.
Our findings are presented to the farm in graph and chart format. The agronomist will include an interpretation of results along with recommendations for future use.
Considering a Field Trial?
We are excited about learning how products and treatments interact with each SWAT ZONE. Talk to your SWAT MAPS service provider about requirements and funding opportunities.
Danielle Epp
Yield Potential Manager


