


Making Sense of Soil Moisture Graphs
Thursday, July 13, 2023 9:00 AM
Reading Time: 4 minutes
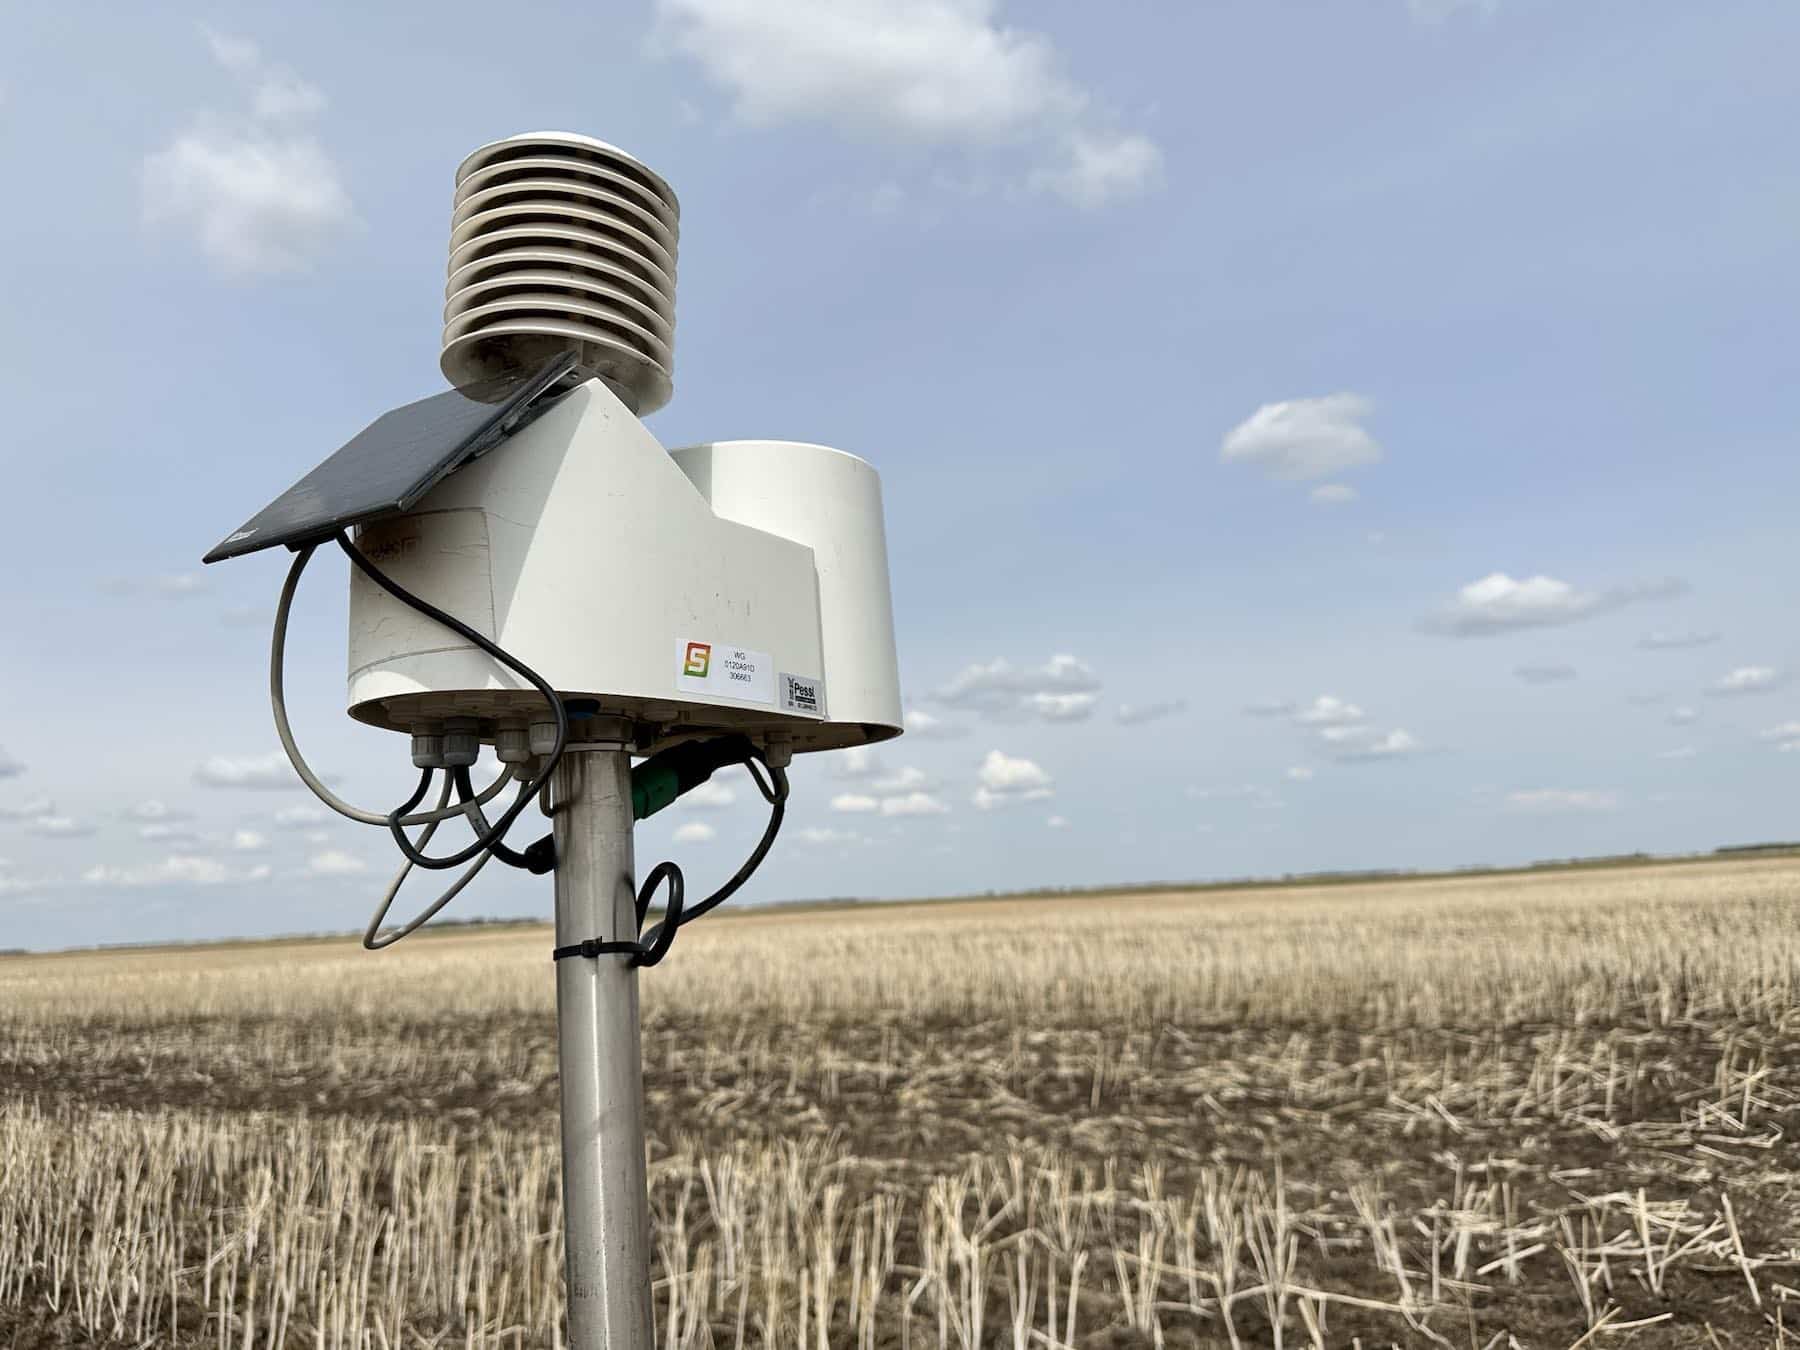
The SWAT MAPS weather station team installs and maintains many weather stations in Western Canada with soil moisture probes for our customers. This technology gives us a window into what is going on beneath the surface and how the roots are interacting with soil and using water. Soil moisture data has gives us further insight into how the crop is performing and can be beneficial for in-season top-dressing applications, for understanding yield analytics post-season, and more.
The team works with different kinds of moisture probes that have between 5 and 12 depth sensors that report hourly readings of soil moisture conditions. Each moisture probe is installed in the field after seeding, positioned between the crop rows, ideally in a SWAT zone that represents the average for the field. This allows us to see how soil texture, heat, root behavior, and rainfall events affect the soil moisture profile.
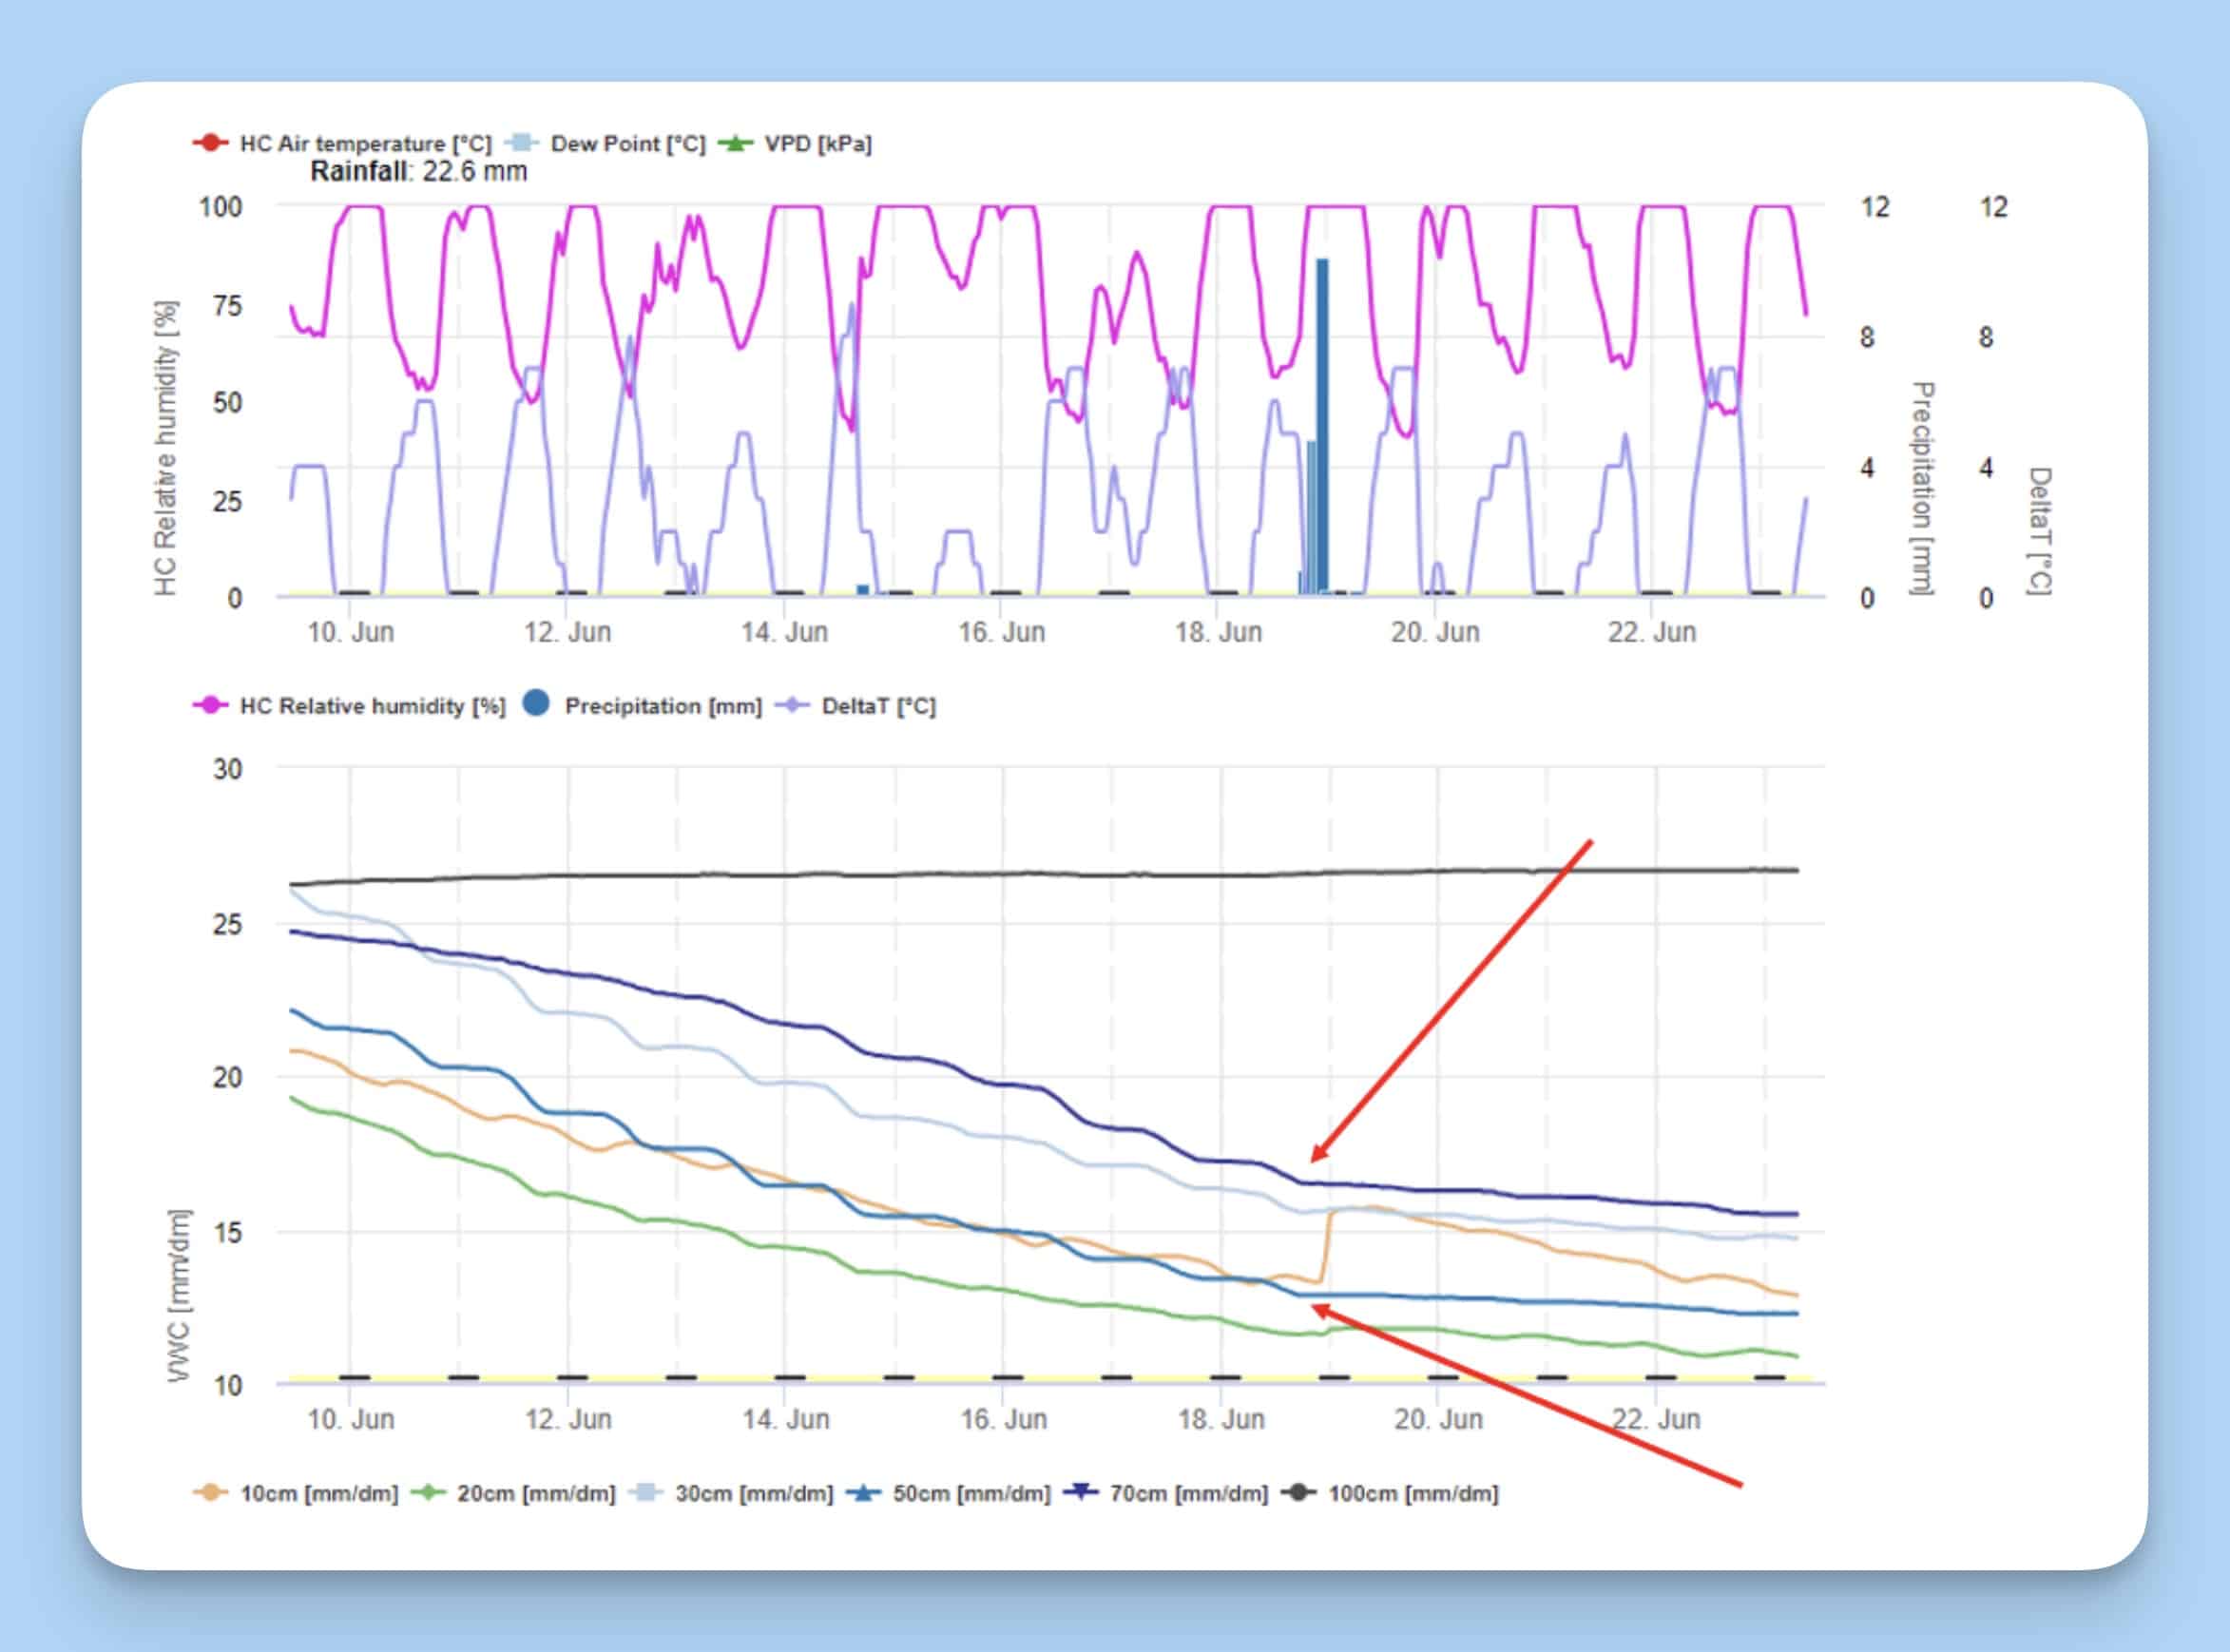
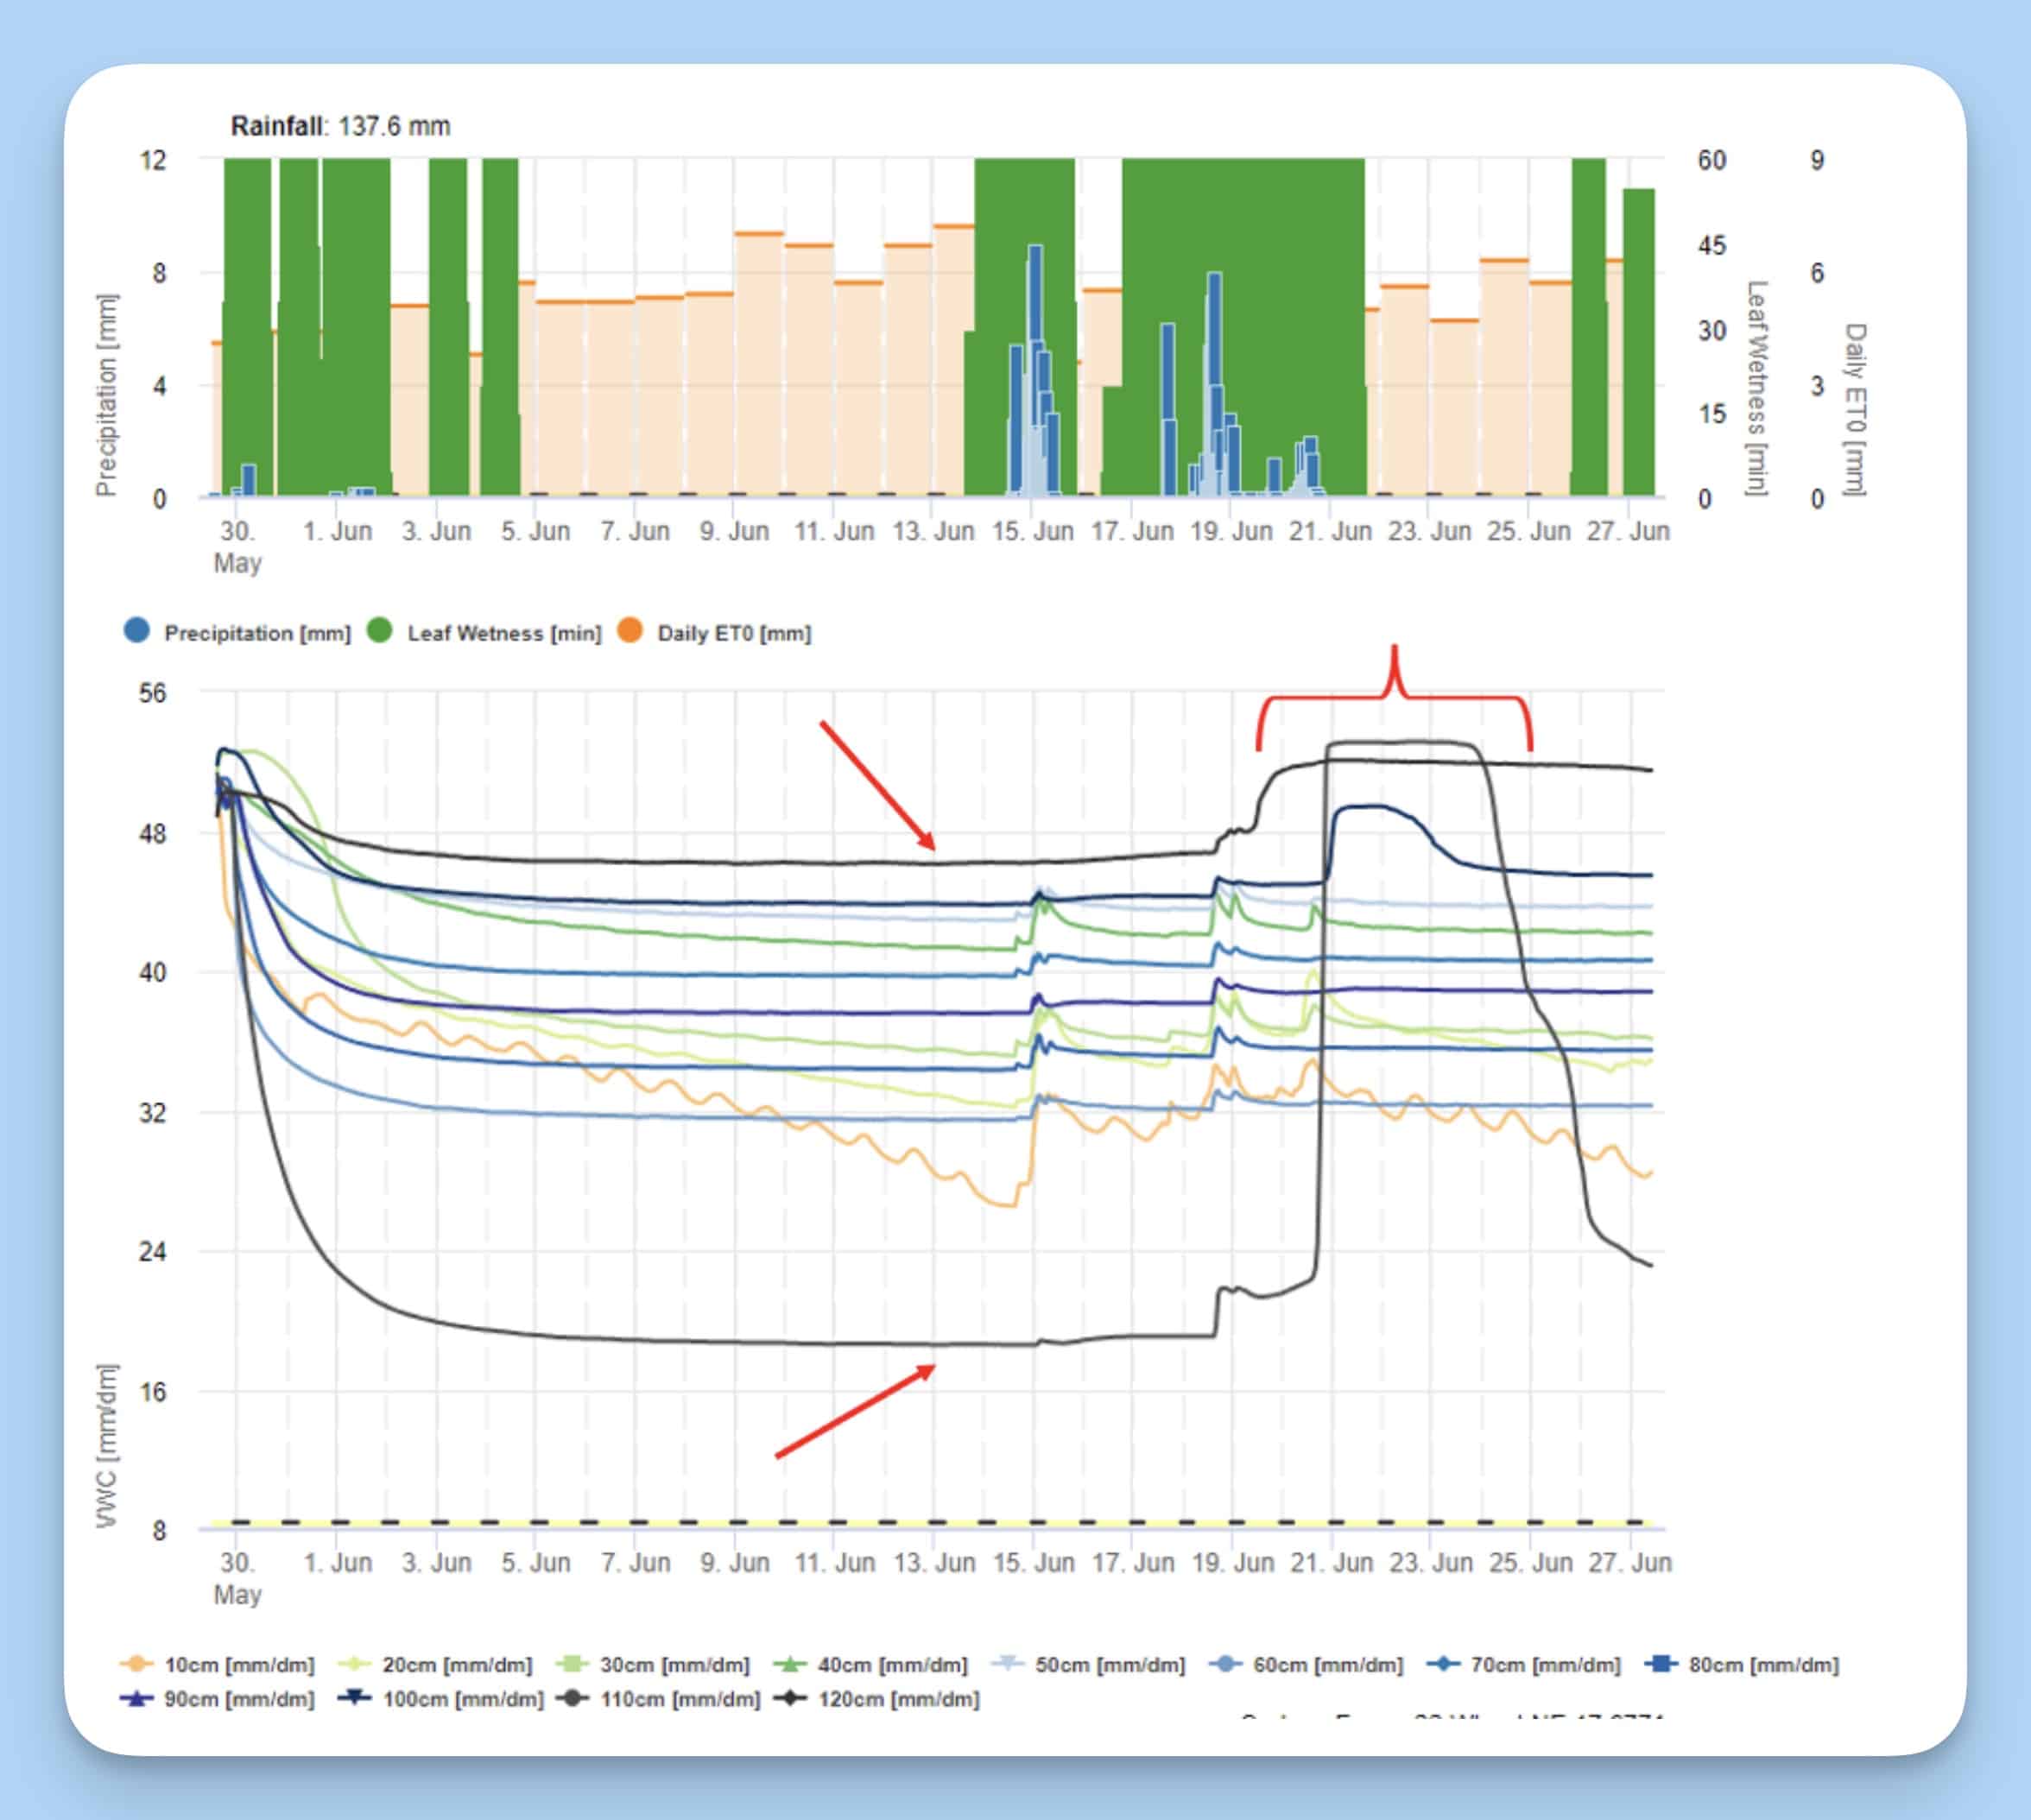
In the first example (above) we have a crop that got a good start to the season and has strong root activity down to 70 cm. The initial soil conditions here were good and the crop was able to develop a good root system that could take advantage of the moisture at depth during the mid-June heat.
A rainfall event recharged the soil moisture at 10 cm and just marginally at 20 cm. After this time, root activity stops below 50 cm. Why extend the energy to the deep roots when there are plenty of easily accessible moisture close to the surface? As that water is used up without additional rainfall the roots at depth will begin to draw moisture again. This also has consequences for nutrient uptake depending on where those nutrients are in the profile. As the topsoil nears wilting point, highly stratified nutrients like phosphate, zinc, potassium, and potentially others may become deficient as the plant continues to grow well on subsoil reserve moisture.
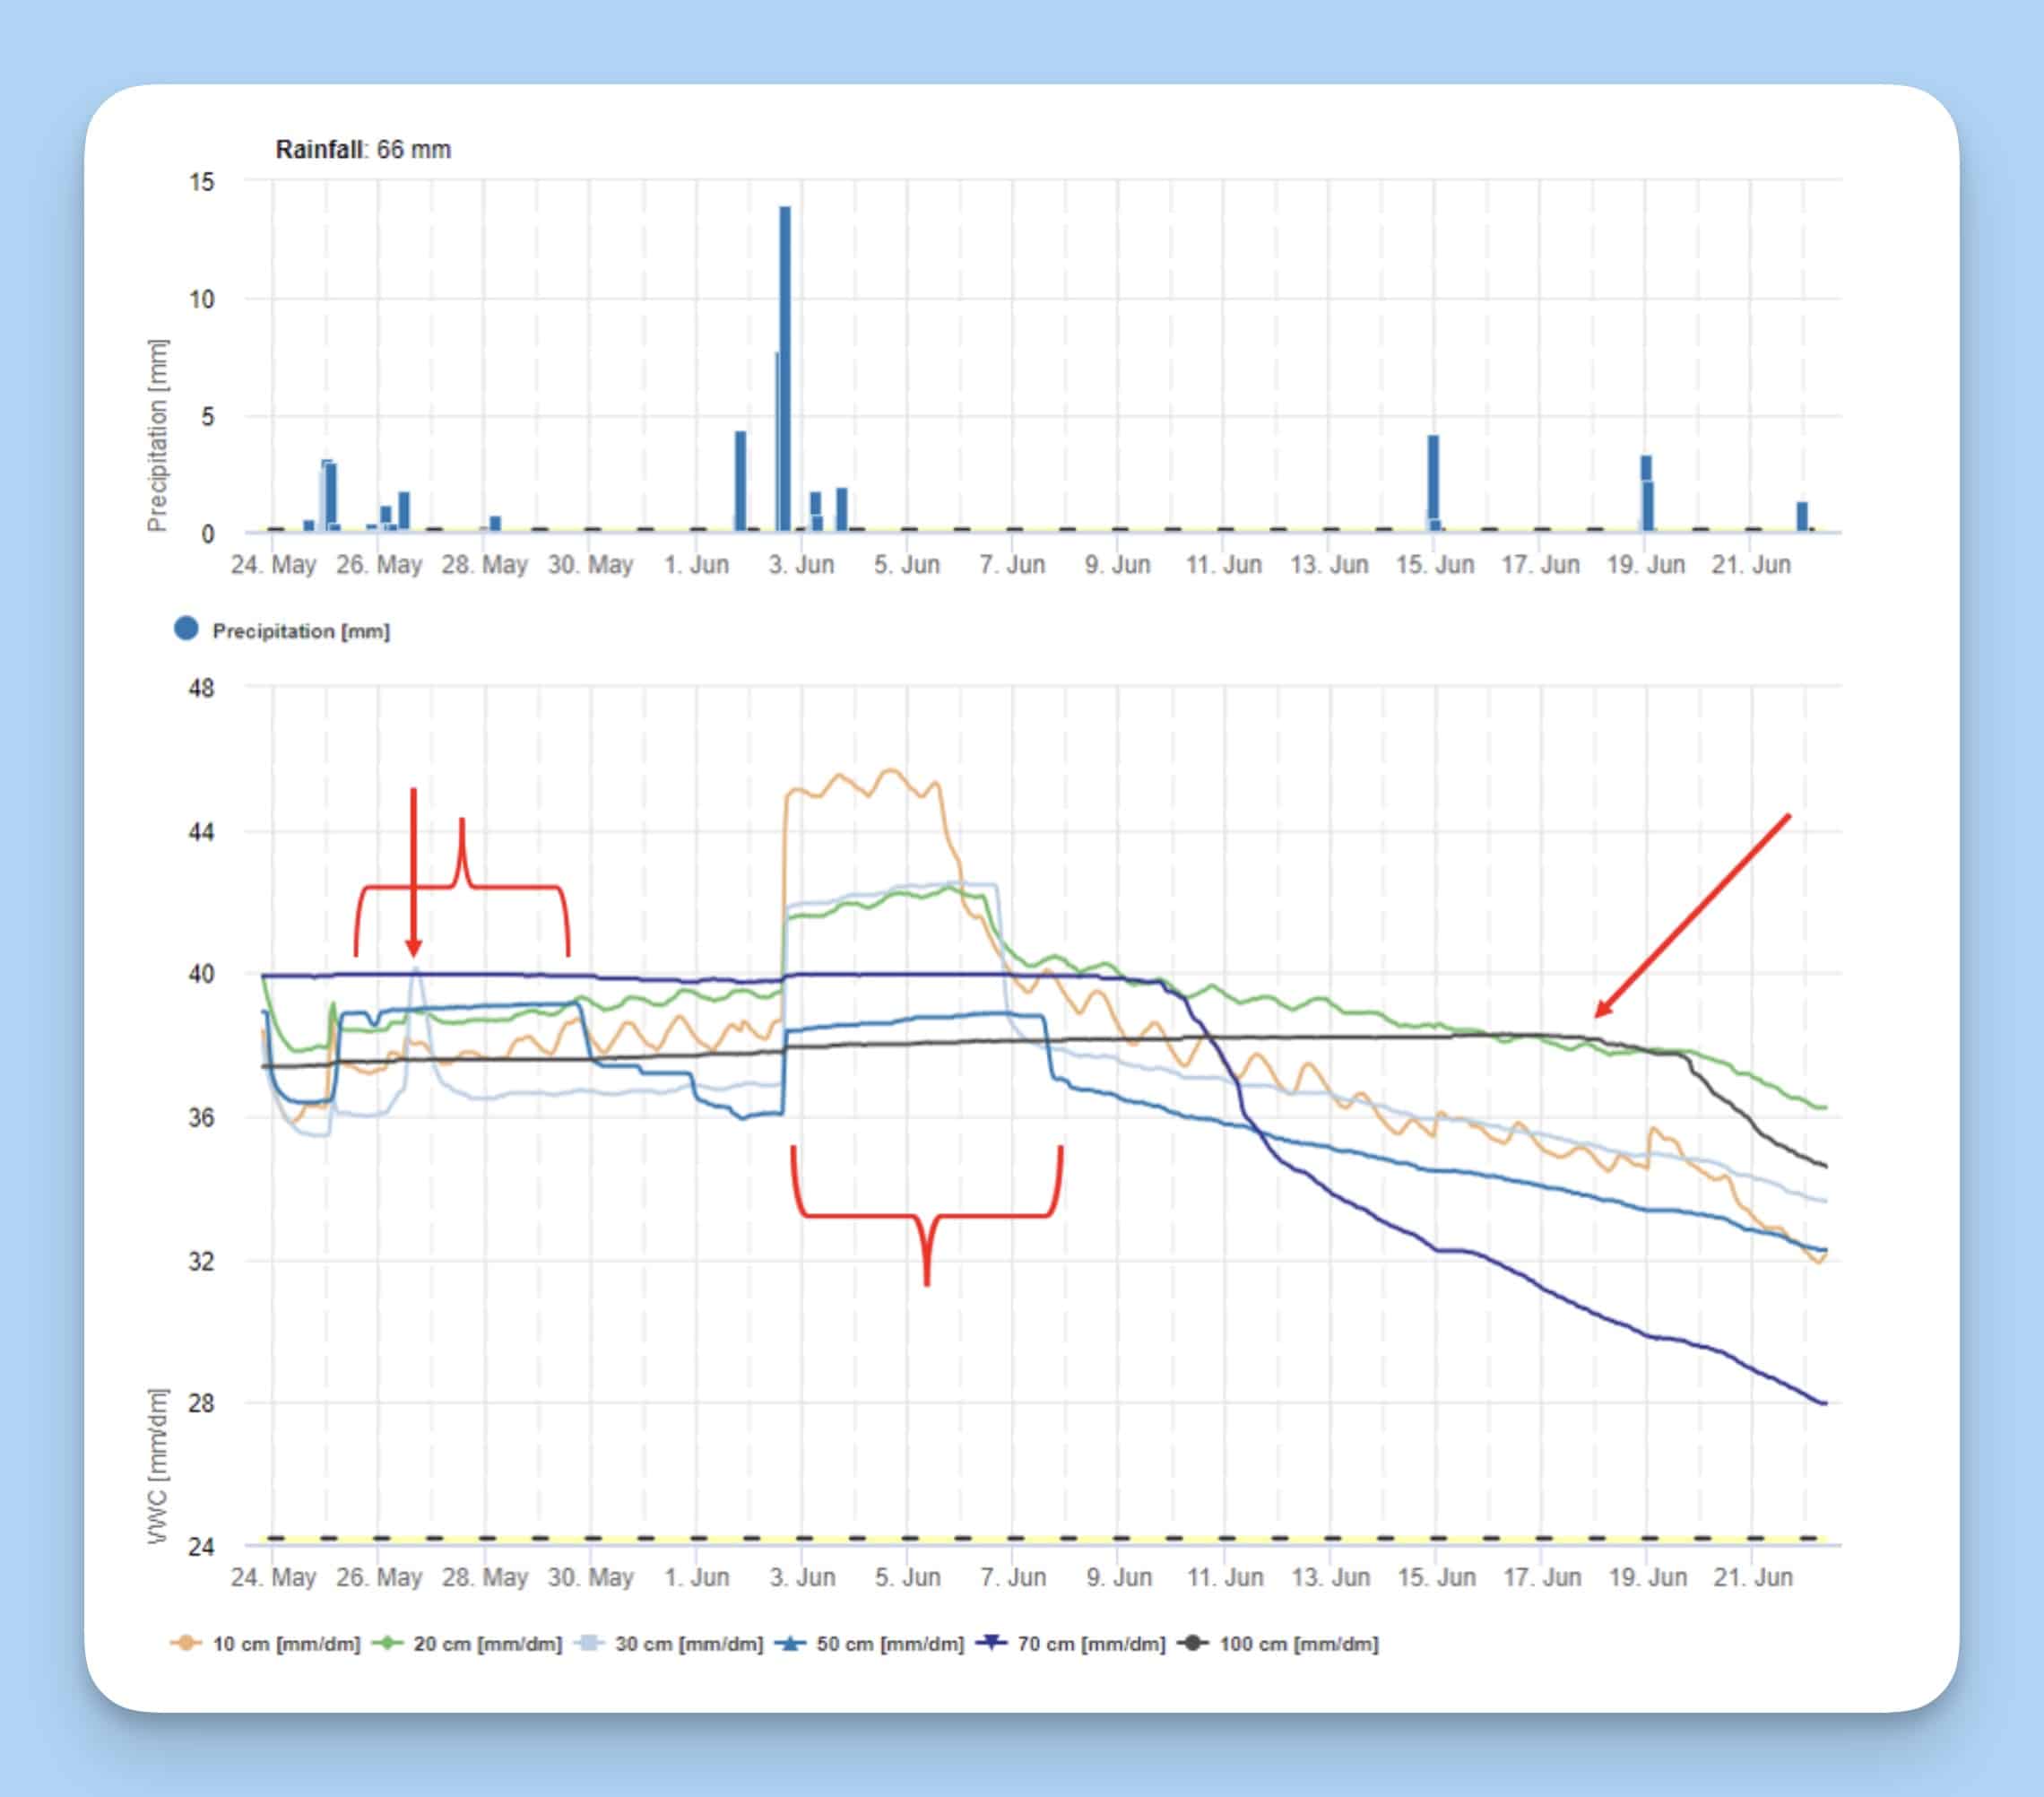
The next example is unique in that it comes from a research site where we have placed the moisture probe in SWAT Zone 10, where we know there is excess moisture.
During installation, it was noticed that the water table was high at this location. You can see in the straight lines of the graph at 70 and 100 cm that nothing is draining here. The water table was at 70 cm depth when the moisture probe was installed. The next rainfall event moved that up to 50 cm and very briefly to 30 cm before draining back off.
A second larger rainfall moved that water table back up to 30 cm for 2 days before draining off again. The 50 and 70 cm sensors start to drain off shortly after as the crop starts using more water. Then in mid-June we finally see the water table drop below 100 cm.
So what does this data mean, and why is it so invaluable to keeping in your back pocket?
Each time the water table comes near the surface, crop stress and denitrification is likely to occur, helping us to make in-season management decisions, or understand why final yield is not as good as expected. It would also help explain developing salinity problems that need to be addressed with subsurface drainage.
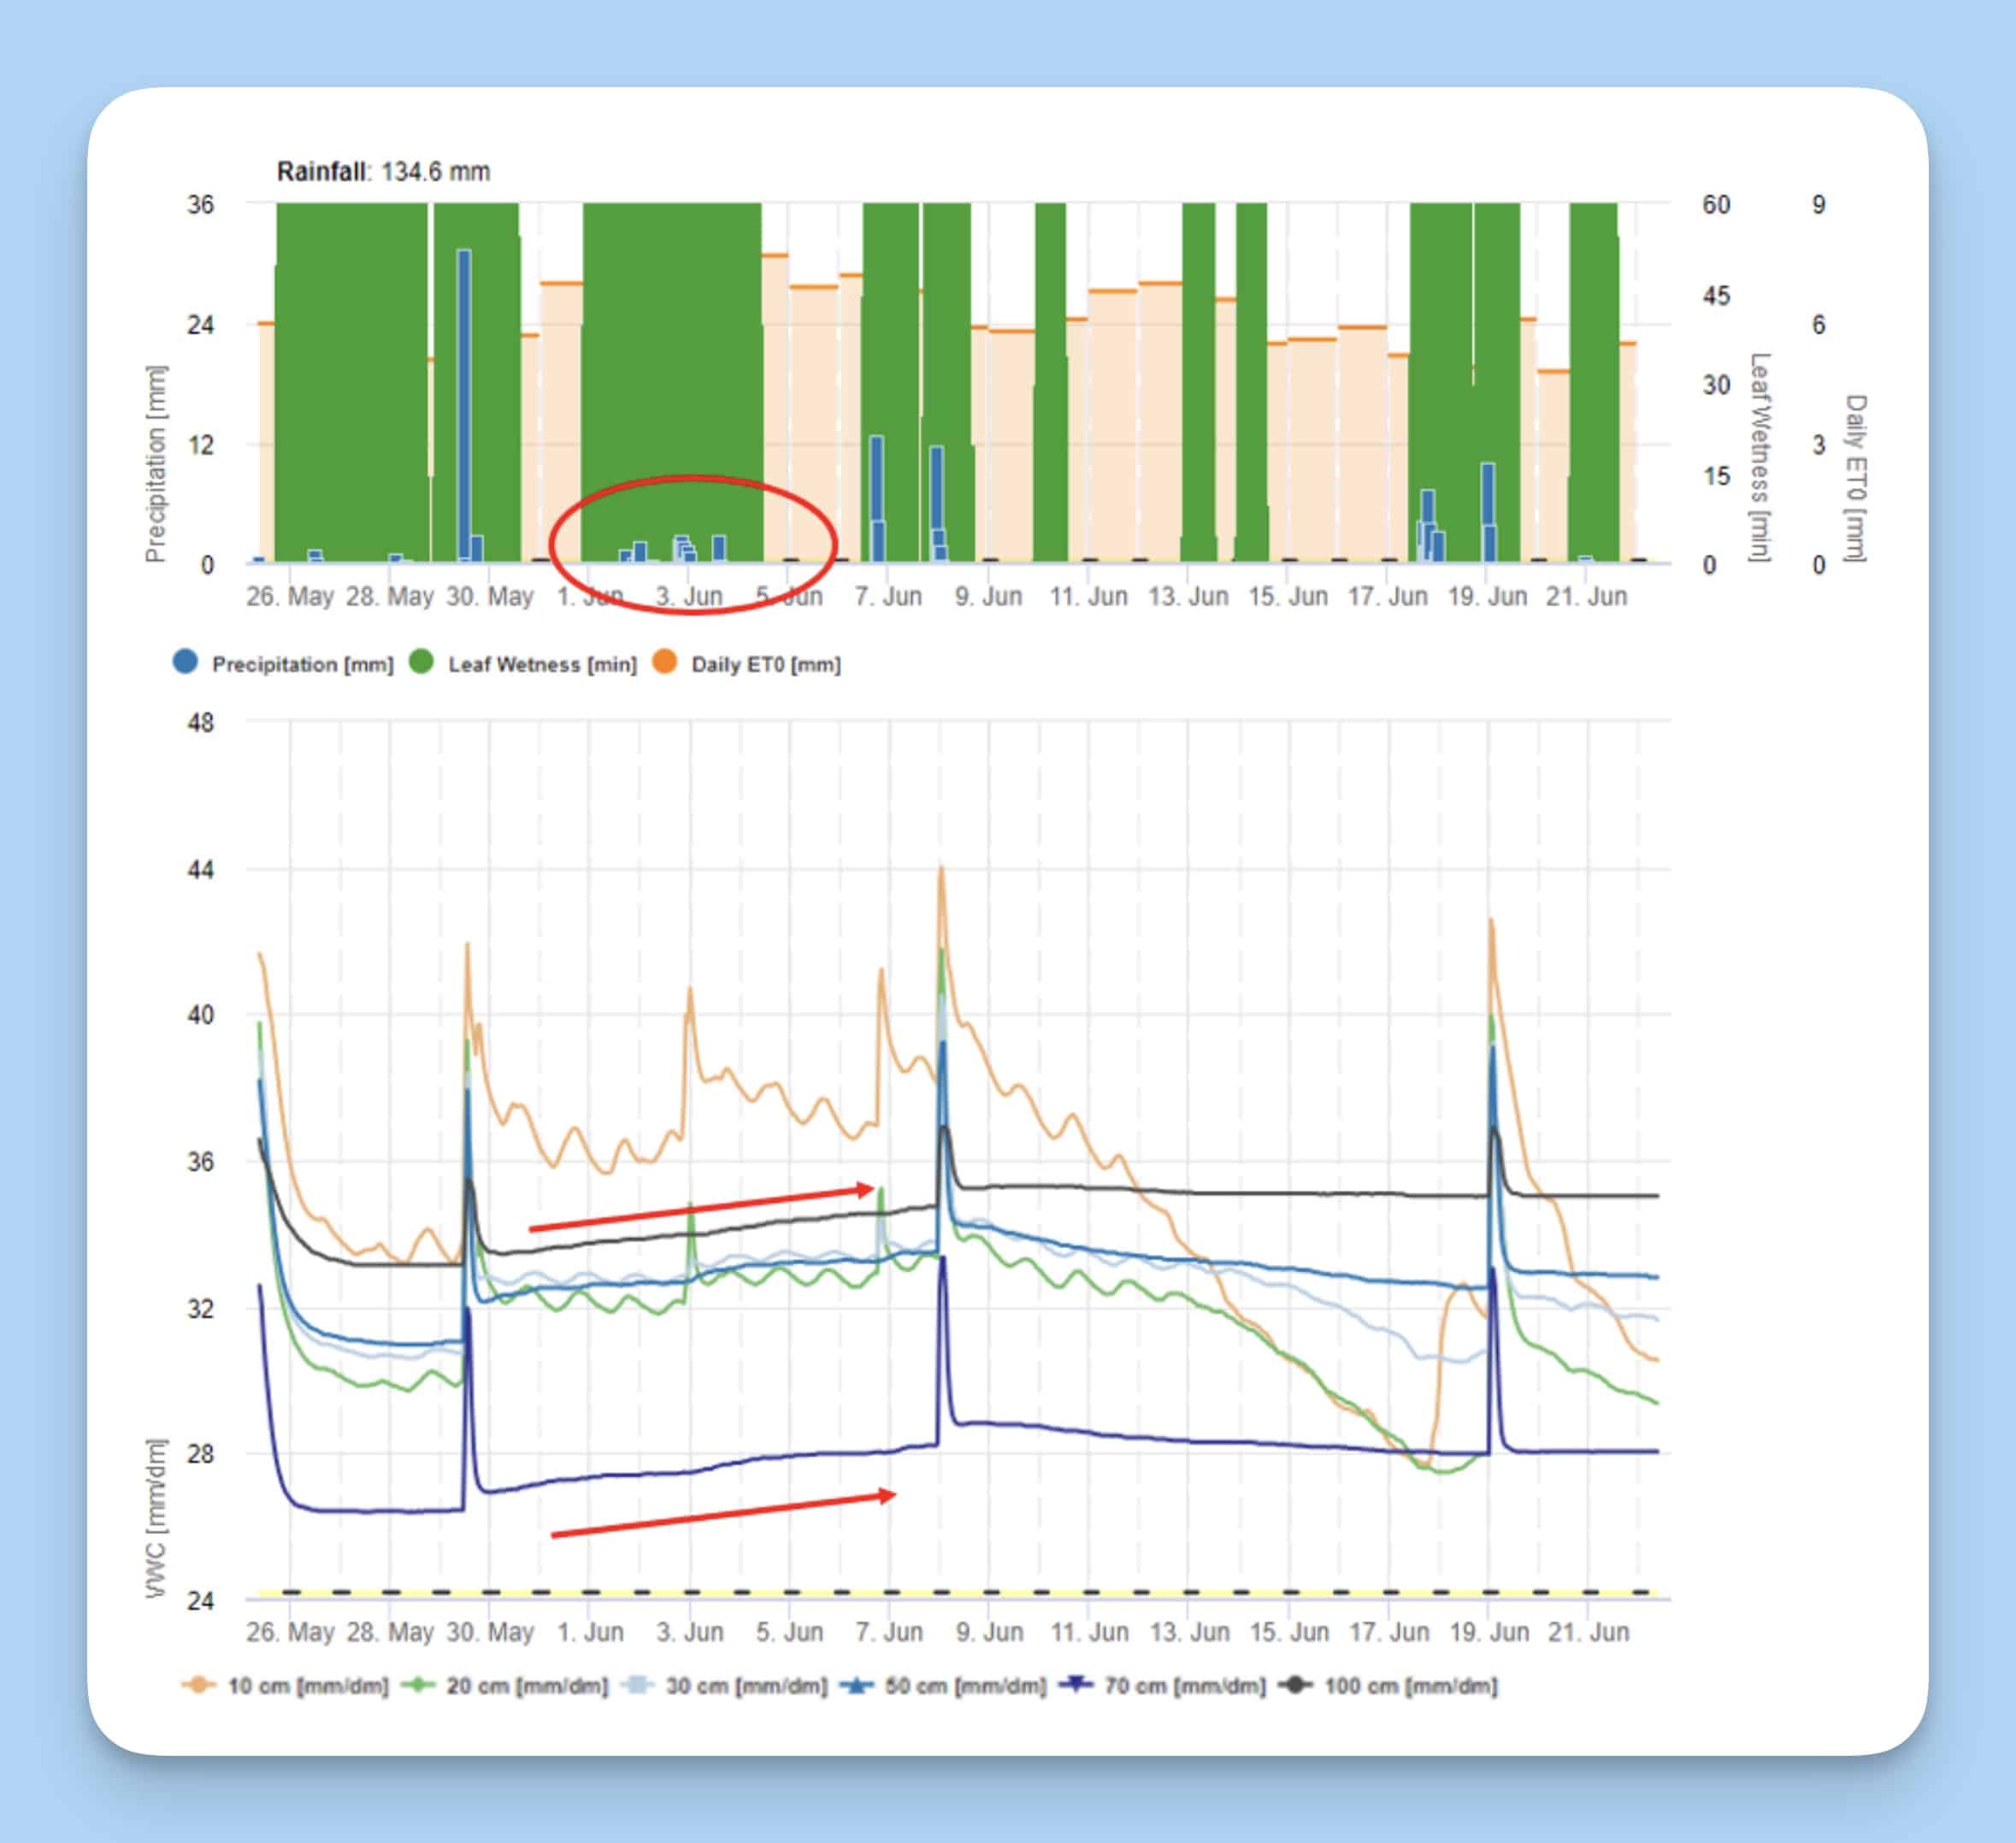
This example is what a full soil moisture profile looks like. The first large rain event of the season brought the moisture levels up to field capacity. You can see the graph lines for each depth sensor spike up and then down again rapidly as the water drains. Over the next few days smaller rains gradually increase the water level at depth so when the next large rain event occurs it can’t hold anymore. After this point the graph returns to the saturation point after each rain. As root activity develops deeper those levels will gradually drop off.
This data shows us that mobile nutrients like nitrogen, sulfur, and chloride are potentially leaching below the current root zone. If it were to show movement deeper than the crop’s typical root depth, topdressing may be required to match water-driven yield potential and account for leaching losses.
This last example is what happens when different soil textures are present at depth after a multi-day rain event. At the surface, this soil is a silty clay loam which trends toward heavier clay at depth, except for a layer of sandy loam at 110 cm. It is this sandy layer that is shown by the lowest line on the graph.
After four days of rain the water has moved through the soil profile and slows down as it hits the lowest layer of clay at 120 cm (shown on the top line of the graph). Water is building up at this point and the sensors at 110 and 100 cm spike up as the water collects. This is particularly dramatic with the sandy loam soil which typically does not hold that much water. As the water drains over the next few days you can see it returns to normal levels.
It's the type of information that you didn’t think you needed, until you do.
Soil moisture probes can provide useful information about how water interacts with the crop and soil textures in the field. Observing data from research sites shows how different SWAT Zones will respond to different moisture conditions. Recognizing a need for drainage solutions, understanding crop stress and yield potential, or managing nutrients in season with SWAT MAPS are all potential benefits of good soil moisture data.
The SWAT MAPS team is here to guide decision making to help you make the best use of this technology. Reach out to get started or to discuss ways on maximizing the work your weather station does for you.
Danielle Epp
Yield Potential Manager
Become a SWAT News insider!
Sign Me Up!
Join Our Mailing List
Enter your email below to sign up for our mailing list.
We care about the protection of your data. We’ll never share your details.
Croptimistic Technology Inc. is an international agriculture technology (AgTech) company. We began operating in 2018. Croptimistic is supported by a growing team of professionals who have dedicated their careers to developing the best soil mapping software and hardware in the world.
Copyright Croptimistic Technology Inc. © 2024 All Rights Reserved.
Privacy Policy
