0
$0.00
0 items
There are many types of maps that can be used to make on-farm management decisions.
While they all have a useful place, it is important to understand what they are telling you, and what they are not. This allows for better management of expensive and logistically challenging inputs.
NDVI MAPS
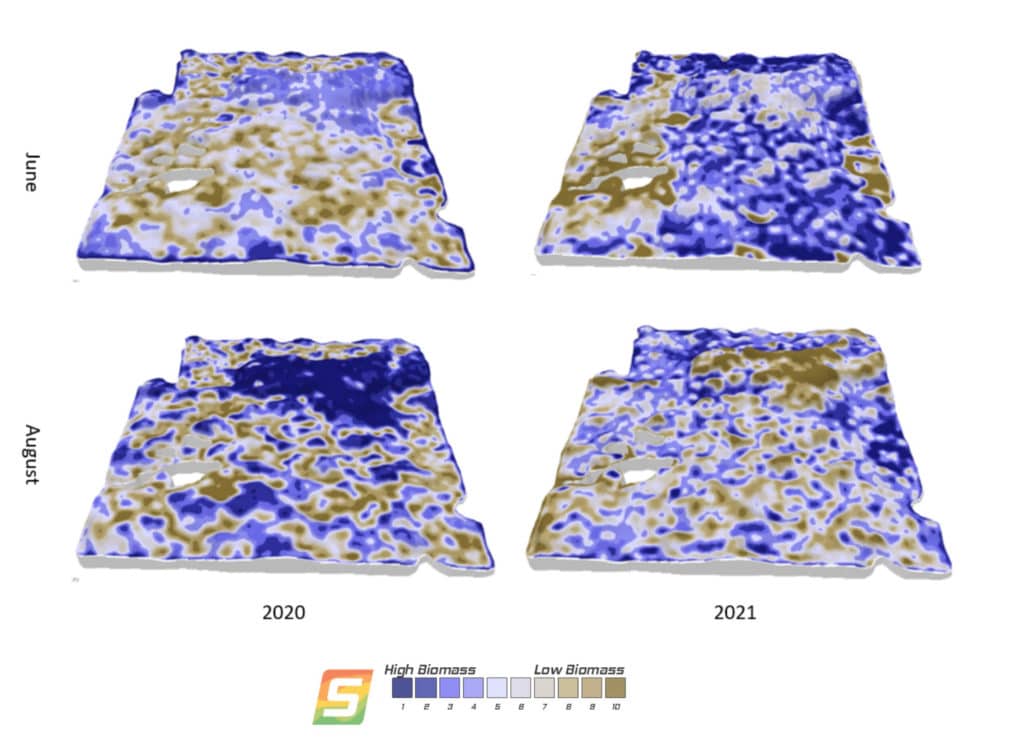
A Normalized Difference Vegetation Index (NDVI) map measures the greenness of vegetation from a satellite image. It quantifies vegetation by measuring the difference between near-infrared (which vegetation reflects) and red light (vegetation absorbs). NDVI maps are great in-season maps to determine where the vegetation is, in the current year. The maps will show concentrations in different areas depending on the year – a dry year will tend to show more biomass in lower areas where water is available, and wet years will tend to show higher biomass on hill tops or slopes, where plants are not waterlogged.
It is also important to note the time of the year the map image is taken – if it is from too early in the season, it will be more of a weed map as the crop has not had a chance to emerge.
NDVI maps that are taken after herbicide application can be useful in fungicide and top-dressing applications, especially if the crop is variable. This map is more reliable as a map of the crop itself, rather than weeds.
Satellite NDVI maps are also at the mercy of atmospheric conditions such as cloud cover. If there is too much cloud cover, imagery will be spotty, and an accurate map cannot be made. Figure 1 shows drastically different imagery where the 2020 conditions were extremely wet and 2021 was a drought year. Cloud cover prevented the imagery from being useful earlier in the growing seasons.

Figure 1. NDVI Maps of the same field at two timings in season from two different years.
Yield Maps
A yield map utilizes data from GPS and sensors to track crop yields across a field. It will tell you where the yield was good or poor, relative within a field, in a single year. Areas of higher yield vs lower yield will change, dependent on temporal conditions of the growing season. This is helpful in determining where crop was more productive and for calculating nutrient removal, but it does not tell you why.
Yield data needs to be cleaned and processed to create an accurate map – factors such as calibration, multiple combines, or changing settings mid-field can affect data.
Why was the yield better in a depression this year than in the past? If you have a few years of yield maps it may help to identify continually problematic areas.
The picture below shows the yield maps from the same field under vastly different conditions, resulting in quite different maps.
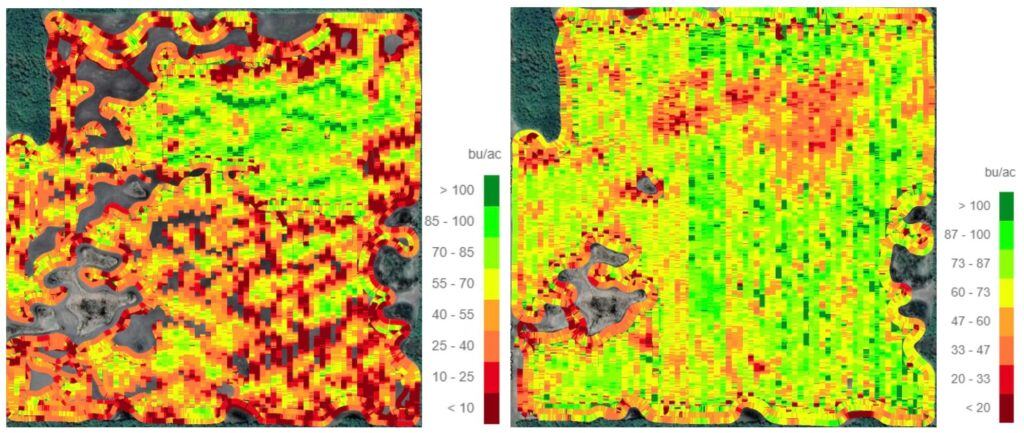
Figure 2: Raw yield maps. Wheat crop in 2020 with extremely wet conditions (L) Wheat crop in 2021 with extremely dry conditions (R)
SWAT MAP
A SWAT MAP is a soil-based map that takes soil characteristics, water flow, and topography into consideration. EC (Electrical Conductivity) is mapped, elevation data is collected and a SWAT CERTIFIED agronomist ground truths the field to ensure that a map is selected that correctly identifies the characteristics into management zones. Soil samples are taken within these zones, analyzed at the lab, and interpreted by the agronomist to understand similarities and differences within a field that allow us and the grower to manage a field with confidence. Fertilizer, seed, lime, herbicides, or amendments can all be managed well when we understand each zone’s soil characteristics such as nutrient availability, organic matter, or salinity.
A SWAT MAP is a stable map that will stay the same year over year. Zones 1 and 2 are typically the hill-tops, coarse textured soils, or are possibly eroded. Zones 5 and 6 move into the slopes of a field, often a consistently productive area of the field. Zones 9 and 10 are reserved for low-lying or saline depressions. Each zone will be different between fields but are always relative to each other with a field.
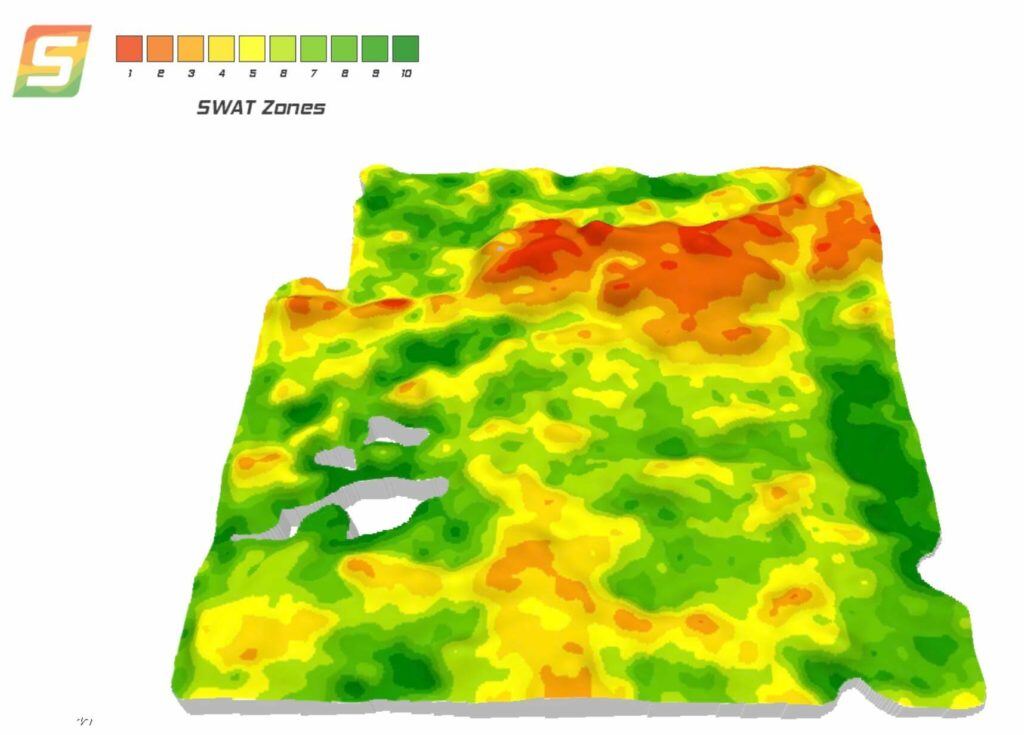
Figure 3. SWAT MAP of the field showing 10 stable soil-based management zones.
In this field, Zone 1s (red) are limited by coarse textures with less water holding capacity and low pH. Zone 10s (dark green) are limited by salinity. These are some of the characteristics, along with nutrient reserves, that help us determine the yield potential across a field, regardless of the conditions that the current year may bring.
Understanding spatial and temporal differences in a field is key to planning and making in season crop management decisions. Having multiple layers of data to work with is helpful, if we know the background and what that data is telling us. Every year will have varying temporal constraints, but if we can map the stable spatial properties, we can manage a crop to its highest potential.