0
$0.00
0 items

Everyone in agriculture knows the importance of soil organic matter (OM). It provides many soil functions, including nutrient cycling, improved water infiltration, and reduces soil bulk density that helps reduce compaction. For these reasons, OM is an important measurement to guide nutrient management decisions.
The challenge, like all things we can measure with a soil test, is variability. Organic matter varies no different than nutrients, pH, and texture across the landscape due to several reasons:
These factors have impacted how much OM has accumulated over thousands of years during soil formation. More recently, farming activities such as tillage, practices that incur erosion, and the addition or removal of organic materials have resulted in further variability across the landscape, and in most cases a net loss of soil carbon reserves.
Confused about the difference between carbon and organic matter? Organic carbon, often referred to as SOC or soil organic carbon, is just that – carbon. Organic matter, however, includes all material originating from living organisms and the nutrients within it, at various stages of decomposition. Typically, the amount of SOC is about 58% of organic matter %. So, if a soil has 6% OM, the SOC would be about 3.5%. Both OM and SOC can be measured in a soil lab. SOC can be used along with a bulk density measurement to calculate the total tonnes/ha of organic carbon in the soil to a given depth.
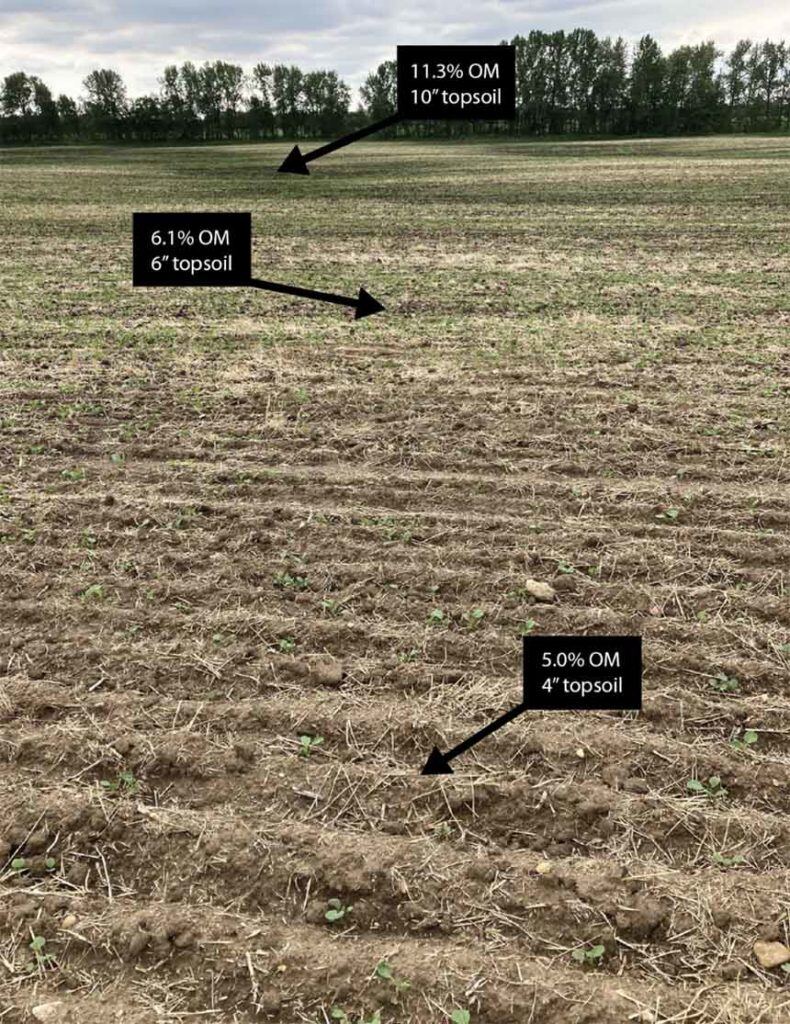
Figure 1. Typical OM variability within a hummocky, glacial till landscape of western Canada.
Typically, in the process of soil mapping with SWAT MAPS, agronomists will observe higher OM values in lower landscape positions and in soils with higher clay content. Lower landscape positions have more water available for plant growth that has accumulated OM for many centuries. In many fields, erosion has also deposited topsoil in depressions, resulting in both high percent OM and increased depth of the A horizon. I’ve soil sampled many fields in northern Alberta with topsoil depth ranging from 10 cm on the top of a knoll to more than 60 cm in wet depressions.
Not all hills and depressions are made equal though! A sandy knoll will not have the same capacity to store organic carbon as a loamy, productive knoll. Historically anaerobic depressions have developed peat or muck soils that are extremely high in OM (I’ve seen as high as 88% OM in a soil test). It is the responsibility of precision agronomists to delineate all these soils and landscape positions for proper variable rate management.
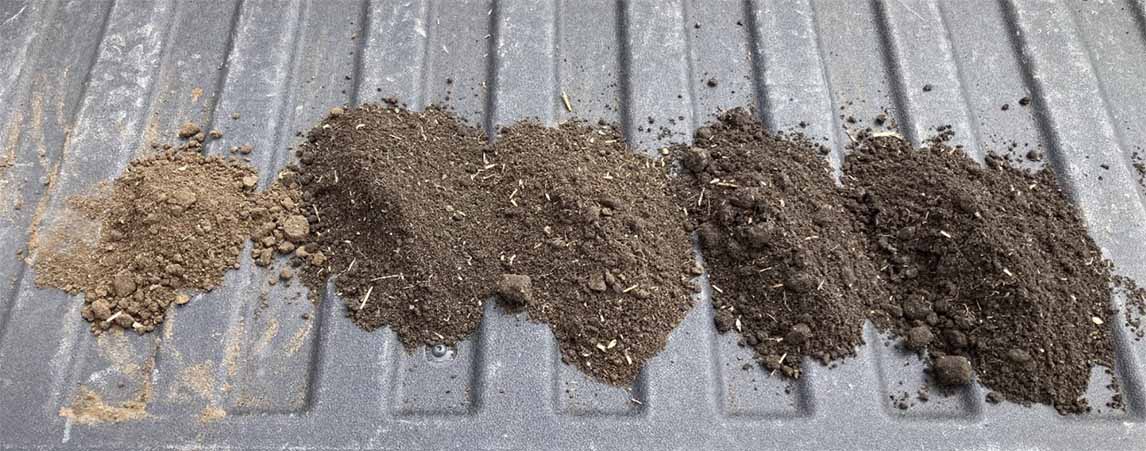
Figure 2. Soil color variation (OM range from 4.9% to 8.5%) in 15 cm soil tests taken from five SWAT zones on a field at Lakeland College, Vermilion, AB.
Another interesting SWAT related observation is the long-term effect of soil constraints such as salinity. It is not uncommon to see lower OM in saline-sodic areas that have not produced much plant biomass for a very long time, and perhaps lost existing OM at a faster rate since cultivation. There are native plant species that can thrive in severe salinity, but very few annual crops will grow well at all. These areas are better off to be mapped and planted back to perennial, salt tolerant species whenever feasible.
Most importantly, OM is a huge reserve of nutrients that are mineralized throughout the growing season, enabling farms to reduce fertilizer inputs in certain areas, or address nutrient limitations where OM is too low to supply the crop. As a rule, for every 1000 kg of carbon in soil OM, there is 100 kg of N, 15 kg of P, and 15 kg of S that can become available to the crop as it is mineralized by microbes.
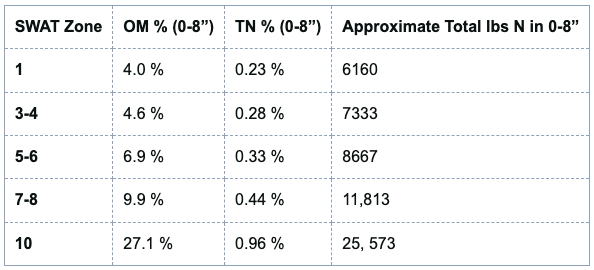
SWAT zones allow us to define this organic nutrient pool more accurately. An example from a field in Alberta, Canada where Total Nitrogen (TN) was tested by zone, showed just how much nitrogen there is in the organic nutrient pool. Note that the last column is using an assumed bulk density of the soil that is unlikely accurate due to texture differences by zone.
Following a similar trend, sulfur deficiency is often observed on eroded, low OM sandy knolls (SWAT zone 1), while only meters away a depression with deep, black soil may not need any sulfur applied at all! Crop lodging in part due to excess nitrates is often observed in lower landscape positions with high OM and mineralization rates. Reducing applied nitrogen in these areas can not only reduce lodging, but improve crop yield, quality, and harvestability! Organic matter mineralization is also an important source of nutrients like phosphate, boron, and zinc. To accurately understand how different soils respond to these nutrients, we need to understand how much OM there is, how deep it is, and relative carbon cycling rates across the landscape.
These are just a few examples of the economic advantages that precision ag technology and high-quality soil mapping with SWAT MAPS can contribute to agriculture. The carbon economy and opportunity to increase stored soil organic carbon will add additional farm revenue in the future. But to understand where we are going and how we get there, it is best to know where we are coming from. A good soil map is that starting point.