


Get More Out of Soil Sampling with SWAT MAPS
Thursday, December 2, 2021 12:00 PM
Reading Time: 2 minutes
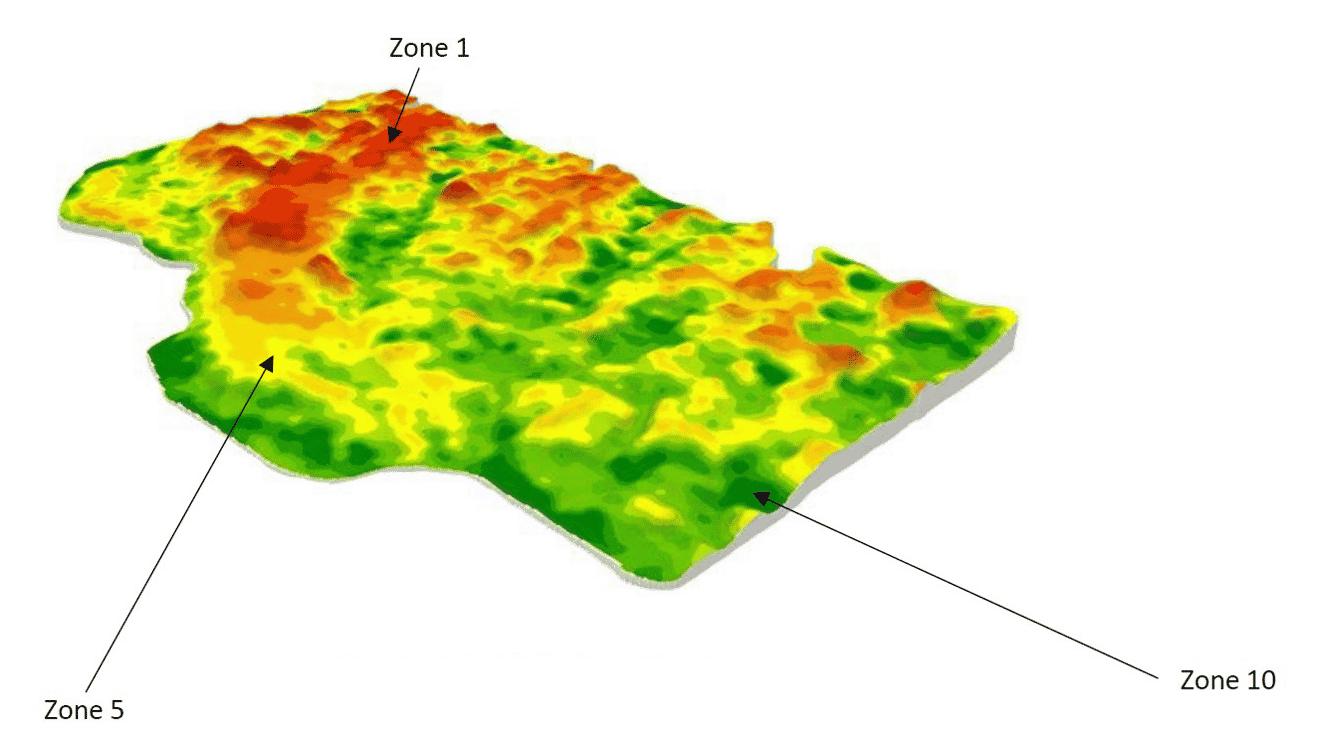
Composite soil sampling has been a very common and inexpensive way to get an idea of nutrients and soil properties in a field. While they are helpful and insightful as to the general characteristics of soils, it can be difficult to delineate any problem or underperforming areas in a field. Each nutrient behaves differently depending on soil type, water flow and topography – features which are captured in high resolution with SWAT MAPS!
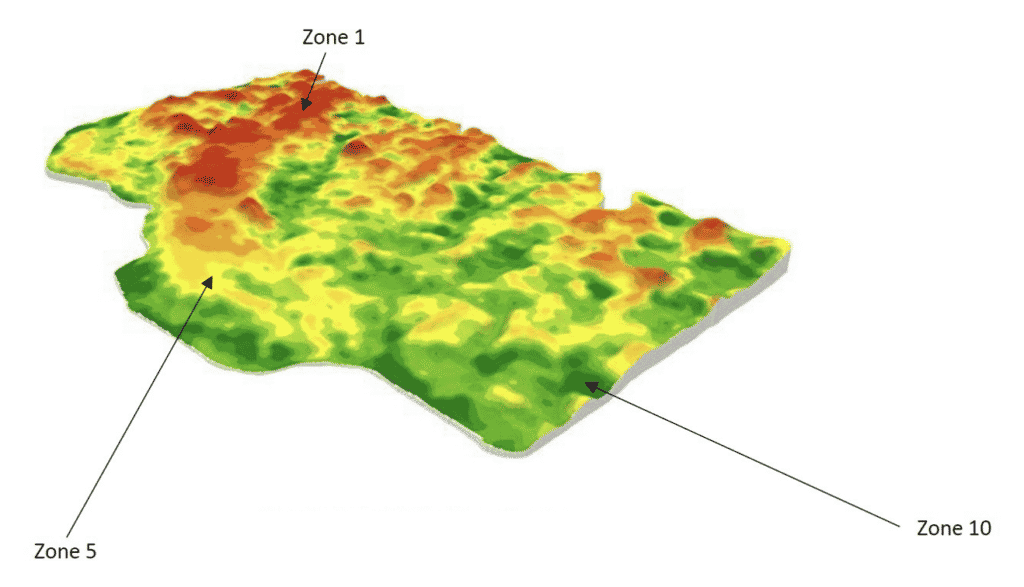
Looking at one field that was SWAT Mapped this fall demonstrated just this. A past composite sample showed no soil or fertility related issues. P levels were healthy at 25ppm, and K levels were good at 176ppm. CEC averaged at 12.8 and pH was at 5.8, an acidic but not damaging level. Once SWAT Mapped, we found elevated P levels in Zones 1 and 2 at 46ppm, indicating these areas haven’t been producing for a while. N levels here were up to 45lbs which would be amplified by the dry year we had in 2021. CEC was as low as 9.3, with an organic matter of 2.2, and K was far below the critical level at 117ppm. pH in these sandier zones sat at an alarming 4.8. Zones 9 and 10 revealed a CEC of 27.3, K levels at 171ppm and phosphate levels at 23ppm. In zones 5 and 6, P levels were the lowest at 11ppm, indicating these have been productive areas and will likely respond to extra fertilizer if applied here. Each of these areas will respond very differently to applied fertilizer.
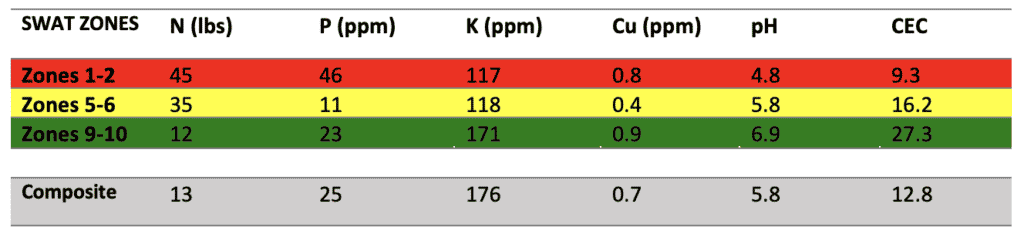
In this same field, the composite soil sampled revealed a decent copper level of 0.7ppm. In the SWAT Mapped sample, zones 5 and 6 (Which previously mentioned were likely the highest producing areas) were low at 0.4ppm. What if you could apply a nutrient as expensive as copper to only 30% of the field that is much more likely to respond to it? It would become much more economical.
Often fields are under producing with no obvious signs as to why. Each nutrient behaves differently in plants and soils and it becomes critical to understand where they might be lacking in order to properly manage them. For example, phosphorus is extremely chemically reactive and is an important nutrient element limiting crop production in most regions of the world after nitrogen (Australian Journal of Soil Research). Higher phosphate levels often remain in under producing areas -the phosphate here simply doesn’t get utilized, so why keep applying more? CEC is an indicator of a soils ability to retain cations such as potassium, calcium and magnesium (Soil Test Interpretation Guide) and often correlate, such as in this example.
When we are able to delineate different areas of the field, there is a lot to learn about current crop response. Composite soil samples will give you an average of all areas while SWAT MAPS can break out soil- based management zones and help to understand and enhance your field management.
References
Holford, I. C. R. "Soil phosphorus: its measurement, and its uptake by plants." Soil Research 35.2 (1997): 227-240.
Horneck, Donald Arthur, et al. Soil Test Interpretation Guide. : [Corvallis, Or.] : Oregon State University, Extension Service, 2011

Become a SWAT News insider!
Sign Me Up!
Join Our Mailing List
Enter your email below to sign up for our mailing list.
We care about the protection of your data. We’ll never share your details.
Croptimistic Technology Inc. is an international agriculture technology (AgTech) company. We began operating in 2018. Croptimistic is supported by a growing team of professionals who have dedicated their careers to developing the best soil mapping software and hardware in the world.
Copyright Croptimistic Technology Inc. © 2024 All Rights Reserved.
Privacy Policy
