0
$0.00
0 items
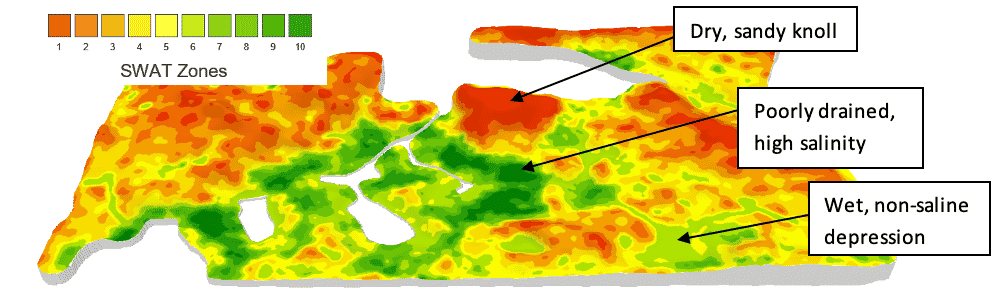
Soil, water, and topography maps (SWAT MAPS) are soil management zone maps that are based on relatively stable, soil based attributes. A SWAT map encompasses multiple soil and water attributes that affect crop variability in any given field, including texture, dissolved salts, organic matter, topography, elevation, water flow paths, and relative water potential.
A SWAT map allows a farmer or agronomist to manage spatial variability across a landscape in several ways, including variable rate fertility, seed, soil amendments, or soil applied herbicides – all of which have responses based on soil and water variability. It becomes a powerful tool when combining temporal variability such as relative soil moisture content with the application of fertilizers to mitigate negative environmental effects.
Parent material is the foundation in which a soil is formed and as a result is the basis for soil type including texture, pH, bulk density, and mineral composition. These properties can all play a part in how nutrients and pesticides should be managed. Topography is foundational data layer that determines where water sheds (runs off) or collects. Water movement across a landscape is a major driver of soil formation (pedogenesis), soil erosion, movement of nutrients and pesticides, and redistribution of organic carbon rich topsoils. When combined with soil properties, it is the primary determinant of yield potential across a landscape. For example, a hill with higher clay content typically has better yield potential than a sandy hill that would often be too dry for optimal crop growth. But a clay depression may be prone to flooding more than a well drained, sandy loam soil in a depression. It is the combination of these factors, as well as temporal variability like rainfall, that guide how a crop should be spatially managed.

Figure 1. Example of a SWAT Map with soil and water properties.
4R Nutrient stewardship is a framework developed to guide farmers toward responsible use of nutrients for the economic, environmental, and social benefit (The Fertilizer Institute, 2021).This framework guides nutrient applications to be applied at the right time, right place, right rate, and with the right source. Historically these 4R principles have been applied at a field scale; in other words, the whole field has been treated the same based on an average soil type. But 4R nutrient guidelines donot recognizefield boundaries. 4Rs are governed by properties like soil texture, soil moisture, crop yield potential, pH, mineralization potential, and soil nutrient levels – all which vary across a field landscape.True 4R nutrient management must acknowledge this variability for full economic, environmental, and social benefit.
Protecting the Air
Nitrous oxide (N2O) is a potent greenhouse gas. It is largely the result of relatively saturated soil conditions causing a biological reaction to occur via bacteria, converting soil nitrate (NO3-) to N2O in the form of a gas to the atmosphere. This process is called denitrification. In 2019, United States agriculture is estimated to be responsible for over 364 MMT (CO2 equivalent) of N2O, most of which comes from “soil management” which includes fertilizer application and other practices that increase nitrogen availability in the soil. On average, there has been a 10.4% increase in N2O emissions from 1990 to 2019 in the U.S. (United States EPA, 2021).
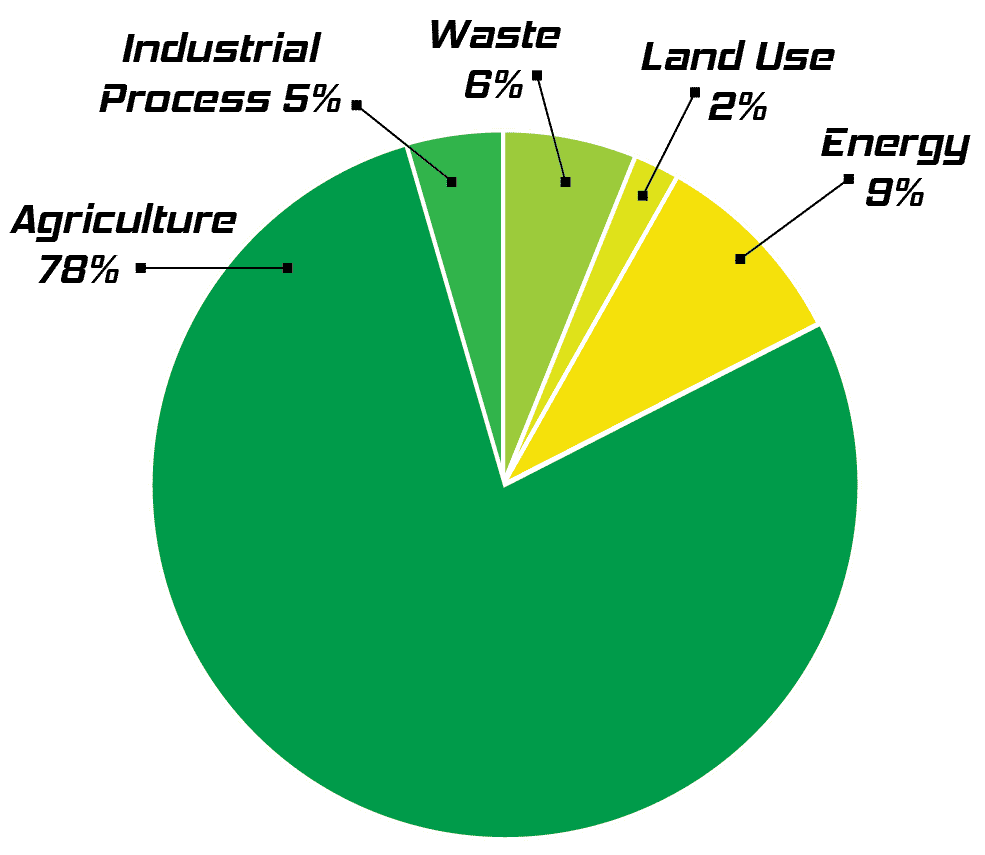
Figure 2. 2019 U.S. nitrous oxide emissions, equivalent to 466.8M tonnes of carbon dioxide (United States EPA, 2021).
Nitrous oxide fluxes are highly linked to soil nitrate availability – higher soil nitrates lead to higher N2O potential. Fertilized annual cropland is a particularly significant source. However, both spatial and temporal variability needs to be considered for loss potential. A depressional area in a dry year doesn’t have the same loss potential as in a wet year when it floods or is saturated. A knoll would have fewer denitrification losses as it rarely stays saturated long enough for the process to occur. Similarly, a well drained sandy loam depression would have less risk of denitrification losses than a poorly drained clay depression that holds water or stays saturated for a longer period.For example, a recently published study showed 57-84% higher N2O emissions from saline-sodic soils compared to more productive soils (Fiedler et al. 2021).
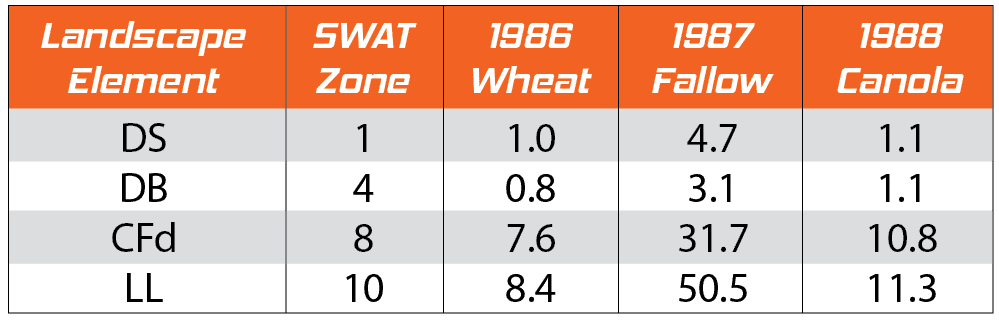
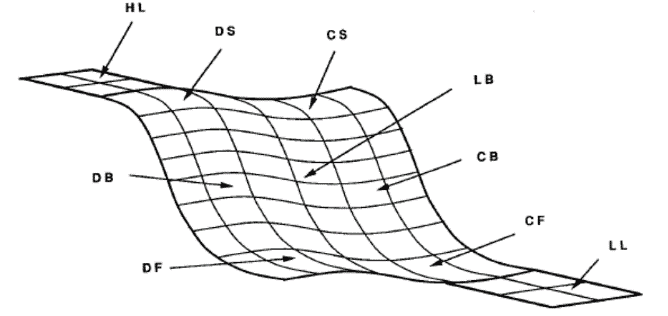
Figure 3. Denitrification estimates (kg N/ha) between April and October (adapted from Elliot and de Jong, 1992).
Fertilization practices also have a large impact on all nitrogen losses. Sources of nitrogen with nitrification inhibitors (i.e., Super U) have shown 8-100% reduced N2O emissions in a range of studies, highlighted in a summary article in Better Crops (Maaz and Snyder, 2018). Application of nitrogen in crop or at seeding time versus several months prior to planting will generally result in less losses. Applying the right rate to match yield potential, considering the soil nitrogen supply, is a best practice. All these practices aim to limit the amount of nitrate-N that is available in the soil at any given time, since that is the form of nitrogen most susceptible to losses.
Top-dress nitrogen in-season based on current soil moisture variability across the landscape, yield potential, and expected nitrogen loss. The accuracy of this application can be enhanced even further utilizing soil moisture probes and detailed texture data to make SWAT W maps – spatial soil water maps that predict the soil water content across a variable landscape.
While there is not one simple solution to mitigating nitrogen losses and N2O emissions, a better understanding of where losses are most likely to occur with a SWAT map is an important first step. Once this risk can be spatially mapped, nitrogen can be measured and better managed with a variety of strategies and agronomic tools in the marketplace today.
Protecting the Water Water quality can be affected by agriculture in numerous ways, including:
SWAT MAPS and associated soil test data can help reduce the risk of water quality issues from agriculture. In most cases the problems listed above result from the over-application of nutrients or pesticides based on the soil types they are applied to.
For example, studies have shown that the amount of phosphorus (P) measured in runoff from fields is highly correlated to soil test P in the soil surface (Little et al., 2006). SWAT maps allow a farmer to identify areas of high soil P levels, allowing reduced P applications in these areas to draw down soil P levels. A similar approach can be taken for nitrogen (N), allowing the proper rate of N to be applied to different areas based on available N in the soil, estimated mineralization of N in-season, and crop uptake requirements. Matching applied nitrogen rates with these parameters will limit the amount of available soil nitrate at any given time, reducing the chance of nitrate leaching, nitrate runoff, and N2O emission as previously discussed.
SWAT MAPS can also indicate water flow paths, location and size of water sheds, and water accumulation areas. With this information, a farmer can identify high risk source areas of contamination to manage differently. This could include reducing nutrient application, avoiding manure application, or even seeding the area to a different crop species. This is a tactic already used in many agriculture areas where waterways or salt affected areas are seeded to perennial grasses that reduce erosion and can provide feed for livestock. A SWAT Map simply helps guide where these high risk areas are and can be targeted with greater precision.
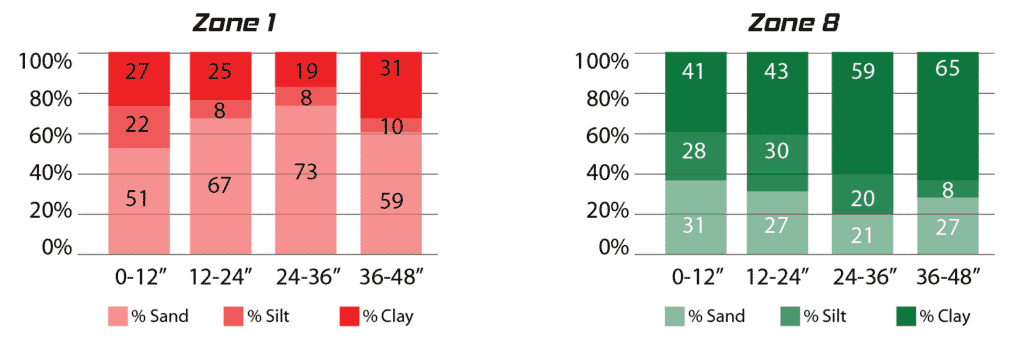
Figure 4. Two soil texture profiles from SWAT zone 1 and zone 8 in a single field.
In this example of two soil texture profiles in a single field, Zone 1 (very sandy) is susceptible to leaching of nitrates, while zone 8 (high clay content) is more susceptible to flooding and denitrification.
While surface runoff of nutrients is a significant problem in almost all agriculture regions in the world, some areas also have problems with nitrate leaching into groundwater. Excess nitrites (caused by reduction of nitrates) in drinking water can cause what is commonly known as blue baby syndrome (methemoglobinemia), or a symptom of nitrite toxicity. High nitrate levels in drinking water can also be fatal to ruminant livestock. Nitrates in these water sources, like surface runoff, is also caused by over-application of fertilizer or manures to soils that are susceptible to leaching – particularly courser textured, sandier soils. The risk of nitrate leaching can be reduced using SWAT MAPS in the same ways used to reduce N2O emissions – applying the proper rate of N, using stabilized nitrogen sources, or timing N application to better match crop uptake.
Nitrogen losses are not just based on soil nitrate levels; excess water is also needed to saturate the soil and move down through the profile carrying nitrate with it. While there is no way to control this in rainfed agriculture systems, irrigation can be managed to reduce this problem. Soil water holding capacity is based on soil texture – one of the properties that makes up a SWAT map. A spatial map of these soil properties, as well as landscape position and water accumulation areas, can help guide variable rate irrigation (VRI) prescriptions with multiple benefits including:
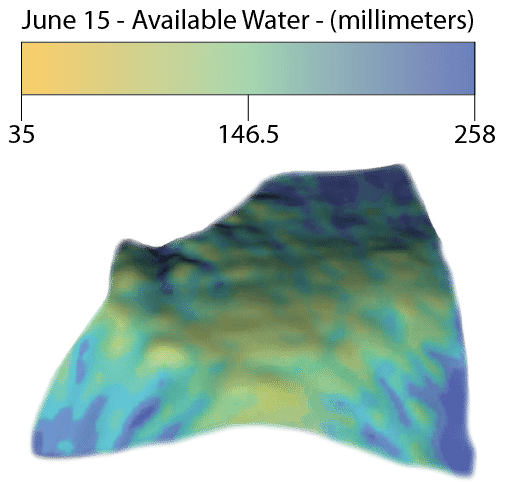
Inclusion of soil moisture probes to monitor plant available water in the soil profile can further improve the accuracy of VRI, especially with the ability to produce a SWAT WATER map – a spatial soil water map that predicts the variability of soil water across a landscape.
Pesticides are another agricultural input that can cause environmental concern in water. Like nutrients, some pesticides are at risk of movement into aquifers or surface waters. This risk is specific to individual chemicals and their solubility in water (Congreve and Cameron, 2019). Relatively soluble pesticides (e.g. atrazine) can easily leach into subsoil water or surface waters. Others are bound tightly to soil particles (e.g. trifluralin) and are at little risk of movement unless there is soil erosion. Off target movement of pesticides in this manor should be treated as seriously as spray drift from one field to another. Understanding the leaching potential of the soil, as well as organic matter and total water holding capacity can help reduce movement of pesticides off site. Well drained irrigated soils are high risk, but precise management of irrigation schedules is one of the most impactful ways to minimize this risk. VRI using soil moisture probes and SWAT WATER maps is a valuable solution for this problem, similar to managing nitrogen and phosphorus losses.
Protecting natural water bodies and aquifers from sources of agriculture pollution is a complex issue that is multi-faceted. Nutrients and pesticides are valuable tools to produce healthy, high yielding crops, but it is imperative to use them according to 4R nutrient stewardship and label guidelines. Knowledge of soil and water variability across a landscape, which SWAT maps can provide, is the foundation for proper nutrient and pesticide application decisions.
Measuring and tracking soil organic carbon
Soil organic carbon (SOC) is a measure of all the organic carbon in the soil which is directly related to organic matter, a commonly measured property in soil tests. Organic matter consists of composed fungi, bacteria, plant material, feces, and any other once-living matter that is at various stages of decomposition and gives soil its black color. Soil organic carbon levels are a direct result of historical plant biomass production in combination with decomposition rates driven largely by climate. Regardless of what the levels are, SOC is sequestered carbon that can be stored in the soil for very long periods of time, rather than as atmospheric carbon dioxide, a well known greenhouse gas.
Organic matter is good for the soil. It improves soil tilth, water holding capacity, and nutrient supply. It sustains microbial life in the soil, providing nutrient cycling and additional carbon sequestration. It is in farmers best interest to maintain organic matter levels for long-term productivity. This also benefits the whole of society since increasing CO2 levels in the atmosphere are linked to climate change. There are two main ways farmers can help change the CO2 balance – emit less CO2 with more efficient use of inputs, and sequester more CO2 in the soil by improving soil management and crop health.
There is a broad desire to measure and track SOC levels in agriculture, but this is not a simple task to do accurately and with repeatability over time.Organic carbon can vary greatly across a landscape, both horizontally and vertically. A single point measurement in a field could yield very different results depending on where it is taken. Over multiple years, some areas within a field could lose SOC, and other areas could gain. Not only that, but a specific point could gain SOC in the topsoil but lose in the subsoil. For accurate tracking, the points of measurement should be based on spatial soil data considering soil texture variation and landscape position.
For farmers, a SWAT map provides the information needed to identify nutrient deficiencies that may be limiting crop biomass and yields, which subsequently limits carbon sequestration potential. A common example would be identifying areas where topsoil has eroded off a knoll. These areas can benefit greatly from composts, manures, and specific nutrients to increase crop production, allowing the soil to increase in organic matter closer its native state prior to it being farmed.
There are many sources of CO2 emissions in agriculture and fertilizer use has an opportunity for improvement. Efficient fertilizer use is critical to minimize the environmental impact as previously discussed. Agricultural lime is also a source of CO2 in agriculture and can be put in a similar category as fertilizers. Lime is a commonly used pH amendment in many parts of the world, used to improve acid soils that limit production. A biproduct of its chemical reaction in the soil is CO2. For this reason, and because it is a significant cost, lime is well suited to a variable rate application where only areas of the field that have a low soil pH are treated.
SWAT MAPS offer a practical way of improving the accuracy of measuring and tracking SOC over time. It gives a methodology to group relatively similar soils together for measurement, balancing cost versus accuracy. It is not practical to measure every square meter of soil, nor is it practical to base measurements on a single point representing 100+ acres. SWAT maps allow a practical solution that consider the variability of SOC in heterogeneous soils. Perhaps more importantly, it gives farmers insight into where and how SOC levels could be improved.
Summary
Agriculture faces many environmental challenges. Whether nutrient losses, pesticide runoff, water use, or greenhouse gas emissions the solution is largely the same – better understanding of water, soils, and their variability across a landscape. Improving our knowledge of this variability will inevitably help farms manage inputs more accurately and efficiently, leading to economic, environmental, and even social benefits. SWAT MAPS is a valuable tool that can be part of the solution, and when combined with other technology such as variable rate capable equipment, enhanced efficient fertilizers, or soil moisture probes, the future of environmentally sustainable agriculture is promising.
References
Aulakh, M. S., & Malhi, S. S. (2005). Interactions of nitrogen with other nutrients and water: effect on crop yield and quality, nutrient use efficiency, carbon sequestration, and environmental pollution. Advances in agronomy, 86, 341-409.
Bongiovanni, R., & Lowenberg-DeBoer, J. (2000). Economics of variable rate lime in Indiana. Precision Agriculture, 2(1), 55-70.
Burton, D. (2018). A Review of the Recent Scientific Literature Documenting the Impact of 4R Management on N2O Emissions Relevant to a Canadian Context.
Calderón, F. J., McCarty, G. W., & Reeves III, J. B. (2005). Nitrapyrin delays denitrification on manured soils. Soil science, 170(5), 350-359.
Cameron, K. C., Di, H. J., & Condron, L. M. (2002). 17 Nutrient and Pesticide Transfer from Agricultural Soils to Water in New Zealand. Agriculture, hydrology and water quality, 373.
Canadian Society of Soil Science. 2020. Soils of Canada. [Online] Available: soilsofcanada.ca [2021].
Chen, D., Suter, H., Islam, A., Edis, R., Freney, J. R., & Walker, C. N. (2008). Prospects of improving efficiency of fertiliser nitrogen in Australian agriculture: a review of enhanced efficiency fertilisers. Soil Research, 46(4), 289-301.
Chen, D., Suter, H. C., Islam, A., & Edis, R. (2010). Influence of nitrification inhibitors on nitrification and nitrous oxide (N2O) emission from a clay loam soil fertilized with urea. Soil Biology and Biochemistry, 42(4), 660-664.
Congreve, M. and Cameron, J. 2019. Soil Behaviour of Pre-emergent herbicides in Australian Farming Systems. Grains Research and Development Corporation. https://grdc.com.au/SoilBehaviourPreEmergentHerbicides
Cornell University Cooperative Extension. (2021, May). Managing P Runoff with the P Index. Retrieved from Agronomy Fact Sheet Series - Fact Sheet 13: http://nmsp.cals.cornell.edu/publications/factsheets/factsheet13.pdf
Coonan, E. C., Richardson, A. E., Kirkby, C. A., Kirkegaard, J. A., Amidy, M. R., Simpson, R. J., & Strong, C. L. (2019). Soil carbon sequestration to depth in response to long-term phosphorus fertilization of grazed pasture. Geoderma, 338, 226-235.
Corre, M. D., Van Kessel, C., Pennock, D. J., & Solohub, M. P. (1995). Ambient nitrous oxide emissions from different landform complexes as affected by simulated rain‐fall. Communications in soil science and plant analysis, 26(13-14), 2279-2293.
Corre, M. D., Van Kessel, C., & Pennock, D. J. (1996). Landscape and seasonal patterns of nitrous oxide emissions in a semiarid region. Soil Science Society of America Journal, 60(6), 1806-1815.
Davies, B., Coulter, J. A., & Pagliari, P. H. (2020). Timing and rate of nitrogen fertilization influence maize yield and nitrogen use efficiency. Plos one, 15(5), e0233674.
Denman, K.L., G. Brasseur, A. Chidthaisong, P. Ciais, P.M. Cox, R.E. Dickinson, D. Hauglustaine, C. Heinze, E. Holland, D. Jacob, U. Lohmann, S Ramachandran, P.L. da Silva Dias, S.C. Wofsy and X. Zhang. Couplings Between Changes in the Climate System and Biogeochemistry. In: Climate Change 2007: The Physical Science Basis. Contribution of Working Group I to the Fourth Assessment Report of the Intergovernmental Panel on Climate Change. Cambridge University Press, Cambridge, United Kingdom and New York, NY, USA, 2007.
Duncan, E. W., King, K. W., Williams, M. R., LaBarge, G., Pease, L. A., Smith, D. R., & Fausey, N. R. (2017). Linking soil phosphorus to dissolved phosphorus losses in the Midwest. Agricultural & Environmental Letters, 2(1), 170004.
Dunmola, A. S., Tenuta, M., Moulin, A. P., Yapa, P., & Lobb, D. A. (2010). Pattern of greenhouse gas emission from a Prairie Pothole agricultural landscape in Manitoba, Canada. Canadian Journal of Soil Science, 90(2), 243-256.
Elliott, J.A. and E. de Jong. 1992. Quantifying denitrification on a field scale in hummocky terrain. Can. J. Soil Sci. 72:21-29.
Fiedler, D. J., Clay, D. E., Joshi, D. R., Engel, A., Marzano, S. Y., Jakubowski, D., ... & Clay, S. A. (2021). CO 2 and N 2 O emissions and microbial community structure from fields that include salt-affected soils.
Futch, S. H., & Singh, M. (1999). Herbicide mobility using soil leaching columns. Bulletin of environmental contamination and toxicology, 62(5), 520-529.
Government of Canada. (2020, January 24). Agriculture and Water Quality. Retrieved from Agriculture and Water Quality: . https://www.agr.gc.ca/eng/agriculture-and-the-environment/agriculture-and-water/watershed-protection/agriculture-and-water-quality/?id=1371491033072
Grover, R. (1973). Movement of picloram in soil columns. Canadian Journal of Soil Science, 53(3), 307-314.
Gurevich, H., Baram, S., & Harter, T. (2021). Measuring nitrate leaching across the critical zone at the field to farm scale. Vadose Zone Journal, 20(2), e20094.
Haddix, M. L., Gregorich, E. G., Helgason, B. L., Janzen, H., Ellert, B. H., & Cotrufo, M. F. (2020). Climate, carbon content, and soil texture control the independent formation and persistence of particulate and mineral-associated organic matter in soil. Geoderma, 363, 114160.
Hargreaves, P. R., Baker, K. L., Graceson, A., Bonnett, S. A. F., Ball, B. C., & Cloy, J. M. (2021). Use of a nitrification inhibitor reduces nitrous oxide (N2O) emissions from compacted grassland with different soil textures and climatic conditions. Agriculture, Ecosystems & Environment, 310, 107307.
Horwath, W. R., & Kuzyakov, Y. (2018). The potential for soils to mitigate climate change through carbon sequestration. In Developments in Soil Science (Vol. 35, pp. 61-92). Elsevier.
Izaurralde, R. C., Lemke, R. L., Goddard, T. W., McConkey, B., & Zhang, Z. (2004). Nitrous oxide emissions from agricultural toposequences in Alberta and Saskatchewan. Soil Science Society of America Journal, 68(4), 1285-1294.
Jamali, H., Quayle, W., Scheer, C., Rowlings, D., & Baldock, J. (2016). Effect of soil texture and wheat plants on N2O fluxes: A lysimeter study. Agricultural and forest meteorology, 223, 17-29.
Lam, S. K., Chen, D., Mosier, A. R., & Roush, R. (2013). The potential for carbon sequestration in Australian agricultural soils is technically and economically limited. Scientific Reports, 3(1), 1-6.
Little, J. L., Nolan, S. C., & Casson, J. P. (2006). Relationships between soil-test phosphorus and runoff phosphorus in small Alberta watersheds. 150 pp. Alberta soil phosphorus limits project, 2.
Lo, T. H., Heeren, D. M., Mateos, L., Luck, J. D., Martin, D. L., Miller, K. A., ... & Shaver, T. M. (2017). Field characterization of field capacity and root zone available water capacity for variable rate irrigation. Applied Engineering in Agriculture, 33(4), 559-572.
Maaz, T. M., & Snyder, C. (2018). The Identification of Management Strategies that Target Multiple Nitrogen Loss Pathways (Part 3 of 3). Better Crops with Plant Food, 102(4), 16-19.
Malhi, S. S., Schoenau, J. J., & Leach, D. (2009, February). Maximizing N fertilizer use efficiency and minimizing the potential for nitrate-N accumulation and leaching in soil by balanced fertilization. In Soils and Crops Workshop.
Malo, D. D., & Worcester, B. K. (1975). Soil Fertility and Crop Responses at Selected Landscape Positions 1. Agronomy Journal, 67(3), 397-401.
McDowell, R. W. (2017). Does variable rate irrigation decrease nutrient leaching losses from grazed dairy farming?. Soil Use and Management, 33(4), 530-537.
Meersmans, J., van Wesemael, B., De Ridder, F., Fallas Dotti, M., De Baets, S., & Van Molle, M. (2009). Changes in organic carbon distribution with depth in agricultural soils in northern Belgium, 1960–2006. Global Change Biology, 15(11), 2739-2750.
Misselbrook, T. H., Cardenas, L. M., Camp, V., Thorman, R. E., Williams, J. R., Rollett, A. J., & Chambers, B. J. (2014). An assessment of nitrification inhibitors to reduce nitrous oxide emissions from UK agriculture. Environmental Research Letters, 9(11), 115006.
Mosier, A. R., Doran, J. W., & Freney, J. R. (2002). Managing soil denitrification. Journal of soil and water conservation, 57(6), 505-512.
Olson, K. R., & Al-Kaisi, M. M. (2015). The importance of soil sampling depth for accurate account of soil organic carbon sequestration, storage, retention and loss. Catena, 125, 33-37.
Ontl, T. A., & Schulte, L. A. (2012). Soil carbon storage. Nature Education Knowledge, 3(10).
Pennock, D. J., Van Kessel, C., Farrell, R. E., & Sutherland, R. A. (1992). Landscape‐scale variations in denitrification. Soil Science Society of America Journal, 56(3), 770-776.
Ritter, W. F., Scarborough, R. W., & Chirnside, A. E. M. (1994). Contamination of groundwater by triazines, metolachlor and alachlor. Journal of contaminant hydrology, 15(1-2), 73-92.
Sandercock, P. J., van Kessel, C., Pennock, D. J., & Farrell, R. E. (1993, February). Spatial variability of deep leached nitrate as related to denitrification in a prairie landscape. In Soils and Crops Workshop.
Schelde, K., Cellier, P., Bertolini, T., Dalgaard, T., Weidinger, T., Theobald, M. R., & Olesen, J. E. (2012). Spatial and temporal variability of nitrous oxide emissions in a mixed farming landscape of Denmark. Biogeosciences, 9(8), 2989-3002.
Shukla, S., & Saxena, A. (2018). Global status of nitrate contamination in groundwater: its occurrence, health impacts, and mitigation measures. Handbook of environmental materials management, 869-888.
Soon, Y. K., & Malhi, S. S. (2005). Soil nitrogen dynamics as affected by landscape position and nitrogen fertilizer. Canadian Journal of Soil Science, 85(5), 579-587.
Spackman, J. A., Fernandez, F. G., Coulter, J. A., Kaiser, D. E., & Paiao, G. (2019). Soil texture and precipitation influence optimal time of nitrogen fertilization for corn. Agronomy Journal, 111(4), 2018-2030.
Stark, C. H., & Richards, K. G. (2008). The continuing challenge of agricultural nitrogen loss to the environment in the context of global change and advancing research. Dynamic Soil, Dynamic Plant, 2(1), 1-12.
The Fertilizer Institute. (2021). 4R Nutrient Stewardship. Retrieved from https://nutrientstewardship.org/4rs/
United States Environmental Protection Agency. (2021, April). Retrieved from Inventory of U.S. Greenhouse Gas Emissions and Sinks: 1990–2019: https://www.epa.gov/sites/production/files/2021-04/documents/us-ghg-inventory-2021-chapter-5-agriculture.pdf
United States Environmental Protection Agency. (2021). Retrieved from Understanding Global Warming Potentials: https://www.epa.gov/ghgemissions/understanding-global-warming-potentials
Van Kessel, C., Pennock, D. J., & Farrell, R. E. (1993). Seasonal variations in denitrification and nitrous oxide evolution at the landscape scale. Soil Science Society of America Journal, 57(4), 988-995.
Zebarth, B. J., Burton, D. L., Spence, J., & Khosa, M. K. (2019). Simultaneous measurement of net nitrogen mineralization and denitrification rates in soil using nitrification inhibitor 3, 5-dimethylpyrazole. Canadian Journal of Soil Science, 100(1), 1-10.
Zhou, Z., Ansems, N., & Torfs, P. (2015). A global assessment of nitrate contamination in groundwater. International Groundwater Resources Assessment Center; Internship report; Wageningen University: Wageningen, The Netherlands.