0
$0.00
0 items

There’s a lot of talk of greenhouse gas emissions and environmental impacts of everything we do. From “carbon footprint” to surface water pollution, agriculture is no stranger to negative attention. But there’s one topic that hasn’t received as much attention but likely will soon – nitrous oxide (N2O).
Nitrous oxide is largely the result of relatively saturated soil conditions causing a biological reaction to occur via bacteria, converting soil nitrate (NO3-) to N2O in the form of a gas to the atmosphere. This process is called denitrification. Agriculture is responsible for an estimated 67% of nitrous oxide emissions, totaling 4.5 million tonnes per year. It is a potent greenhouse gas with a global warming potential of 265-298 times CO2, but we can forget that for a moment and just accept that if your soils are emitting nitrous oxide, you’re losing nitrogen. And losing nitrogen that you’ve spent money on is never a good thing. I truly hope that our industry doesn’t have regulations imposed on us to control emissions, but discussions on the topic are certainly happening in Canada and no doubt in other countries around the world too.
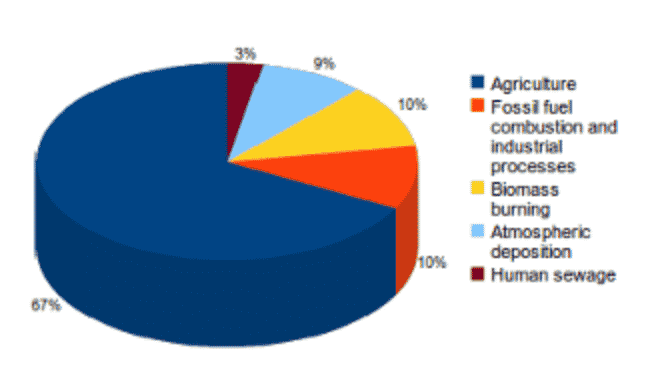
Figure 1. Human sources of N2O.
So what are the driving forces behind denitrification? Nitrous oxide fluxes are highly linked to soil nitrate availability – higher soil nitrates leads to higher N2O potential. Fertilized annual cropland is a particularly significant source. But, both spatial and temporal variability needs to be considered for loss potential. A depression area in a dry year doesn’t have the same loss potential as in a wet year when it floods or is saturated. A knoll would rarely have high denitrification losses as it rarely stays saturated long enough for the process to occur. Similarly, a well drained sandy loam depression would have less risk of denitrification losses than a poorly drained clay depression that holds water or stays saturated for a longer period of time.
Fertilization practices also have a large impact on all nitrogen losses. This is considered in the “4Rs” - the right source, right rate, right time, and right place. Sources of N with nitrification inhibitors (ie. Super U) have shown significantly reduced N2O emissions in some studies. Application of nitrogen in crop or at seeding time versus several months prior to planting will generally result in less losses. And of course applying the right rate to match yield potential, considering the soil nitrogen supply, is a best practice. All these practices aim to limit the amount of nitrate-N that is available in the soil at any given time, since that is the form of nitrogen most susceptible to losses.
The following figures offer denitrification estimates (kg N/ha) between April and October at different landscape positions (and estimated SWAT zones).
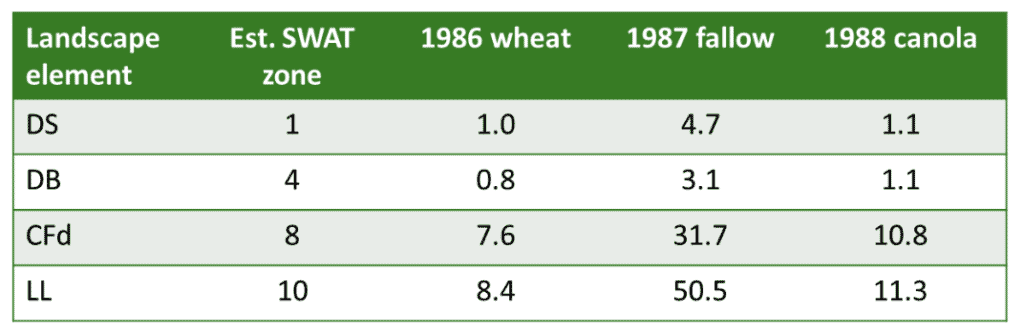
Figure 1. Human sources of N2O.
Figure 3. Landscape positions
What if we can use precision agronomy to combine several best practices to address the problem? SWAT MAPS can be used to do just that – to consider the spatial variability of water flow and accumulation, differences in soil texture, and crop yield potential across a landscape. With SWAT MAPS we can:
True 4R nutrient stewardship doesn’t care about field borders – it considers sand vs. clay. It considers wet vs. dry. It considers good vs. poor yield potential. It considers high mineralization rates and low mineralization rates. It considers nutrient balance, pH, depth of topsoil…. etc. This is all spatial variability that SWAT MAPS can capture and use to manage nitrogen better. As an industry, we need to manage it – before someone else tries to manage it for us. And you can’t manage it until you map it.
References: