


Soil-Based Management Zones: How Are You Determining Your Soil Potential?
Wednesday, December 16, 2020 12:00 PM
Reading Time: 4 minutes
Soil management is a hot subject these days. Many companies are selling that “magic” formula, stating what you are doing wrong, and declaring they know your farm and your soil better than you… Most farmers know their fields better than the back of their hand. They know where it’s prone to flooding, which area just never seems to yield very well, and that one spot they get stuck every year seeding. In fact, the only thing that may know the fields better than the farmer… are the fields themselves! Your soil says a lot about its own potential, we just need to listen to it. How do we do that? Soil testing! And how do we make sure we are getting the best bang-for-your-buck with those soil tests? Soil maps and zone sampling!
Many companies offer soil maps, but how are they collecting their data? Have they actually been out to the field themselves? What pieces of technology are they using to find out what the soil is saying? The short answer is for most companies is imagery and/or yield data (crop biomass and yield based maps), as it’s easily collected and generates large amounts of data available at their fingertips. But for the few willing to put in the time and effort, soil potential maps are far superior for improving soil management!
Imagery and Yield-Based Maps
There are many ways to collect this type of data, the most common being satellite imagery. Drones and other pieces of equipment that measure crop biomass and yield are also used, but typically require more effort to gather the data. Companies gravitate to satellite imagery as it is readily available and easily accessible for anyone to use. These technologies capture everything that may be affecting the crop at that specific time; insects, weather, moisture, seeding mishaps, soil related issues, and the list goes on and on. However, with all this amazing information in one picture comes a challenge… How do we determine which factors are directly related to the soil, affecting how you will manage the soil itself?
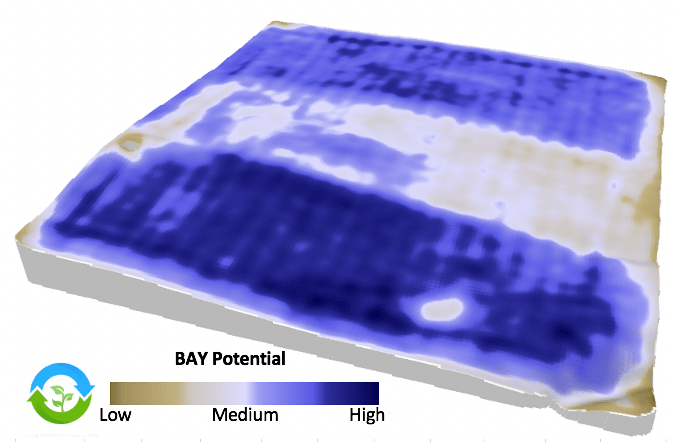
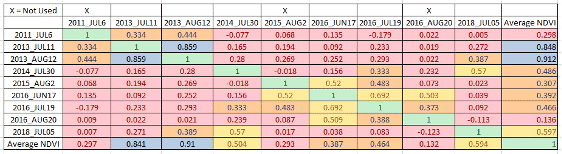
Many problems tend to arise when choosing to use this data. To make a proper map based on imagery, you need a few images from a few different years, and they must correlate strongly enough to be used to make the map. This is typically very challenging as good images are tough to find; often it is cloudy, the crop isn’t big enough, or even certain cropping histories can affect the outcome of the map. Also, soils with completely different characteristics requiring different management strategies end up grouped and sampled together. As with yield mapping, more often than not the monitors aren’t calibrated correctly, and this becomes especially challenging when multiple combines are involved in the same field. It takes an extremely talented person and countless hours to process the data into a usable form. These forms of data tend to produce maps that have a lot of information about “what is going on” but are typically lacking an answer to “why is this happening.”
Soil Potential Maps
Maps based on the soil are becoming increasingly more common. They have been in use for many years already but recently have sparked a lot of interest. A little more work is required for a soil potential map over a yield potential map, but the difference is quickly noticed when working with the maps. Many important layers of information are captured using sensors in the field, processed, and utilized to allow us to truly understand what the soil is telling us.
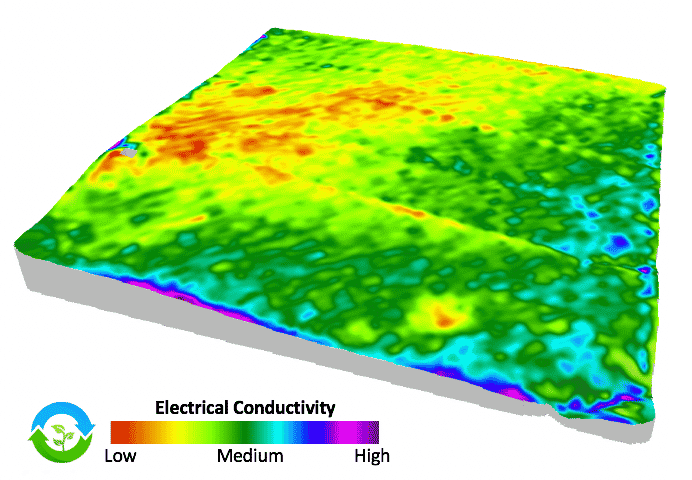
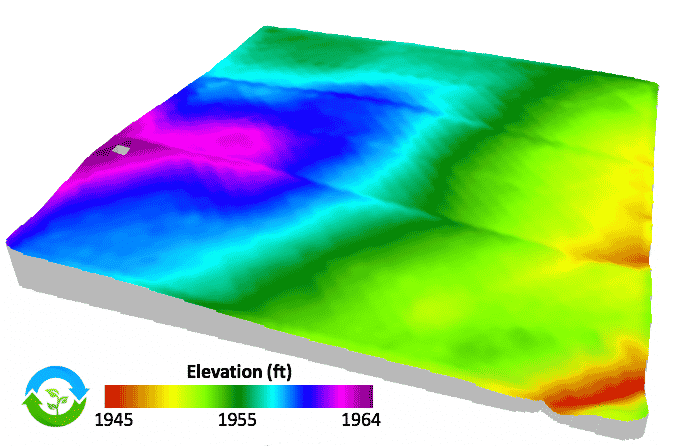
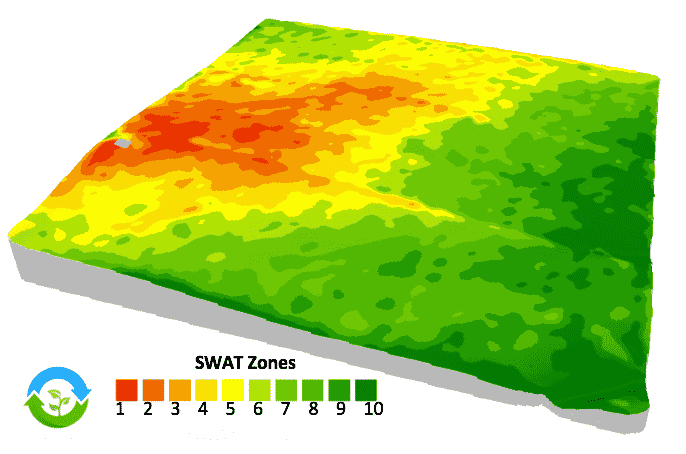
Layers that are essential for the development of these maps include electrical conductivity (EC) and elevation. These data sets are very stable, so the map created is good for the life of the field. With a little bit of processing the raw data is converted into usable data such as relative EC, topography, and water flow paths. Electrical conductivity gives us insights into the soil – textures, salts, erosion. Topography defines the depressions from the hills. The water flow paths give insight to where the water is going in the field. When layered together into a soil map, zones are created that delineate the soil by fertility influencing factors (Soil, Water, and Topography, or SWAT). Soils that have similar characteristics, whether it be moisture, fertility, or even erosion, are then soil sampled accordingly.
Conclusion
Soil potential maps are becoming increasingly more popular as more and more farmers and agronomists begin to see the value of correctly developing management zones. For all soil-related processes on your farm, SWAT MAPS are the best foundation on which to base your management practices. Imagery and yield provide a good “report card” on how the year went but are not suitable for the development of management zones. Contact us to learn more about how to improve your farm management practices with SWAT MAPS.
Tyson Walker
Mapping Services Manager
CropPro Consulting
tyson@croprecords.com
Become a SWAT News insider!
Sign Me Up!
Join Our Mailing List
Enter your email below to sign up for our mailing list.
We care about the protection of your data. We’ll never share your details.
Croptimistic Technology Inc. is an international agriculture technology (AgTech) company. We began operating in 2018. Croptimistic is supported by a growing team of professionals who have dedicated their careers to developing the best soil mapping software and hardware in the world.
Copyright Croptimistic Technology Inc. © 2024 All Rights Reserved.
Privacy Policy
