


Risk Management Wins Again
Monday, August 24, 2020 12:00 PM
Reading Time: 3 minutes
Unfortunately, the 2020 season in northern AB has brought widespread flooding of seeded areas again, with massive economic loss. Accumulated rainfall in the greater Edmonton region from April 1 to August 17 is now 325-400 mm, and the soil profile was full to begin with from an exceptionally wet fall in 2019.
When we think of risk management we often think about drought, and there are certainly opportunities to manage drought risk using SWAT Maps and variable rate inputs. But in wet climates, there is an equally good opportunity to manage risk of wet soils and flooding, which has been proven to me first hand two years in a row.
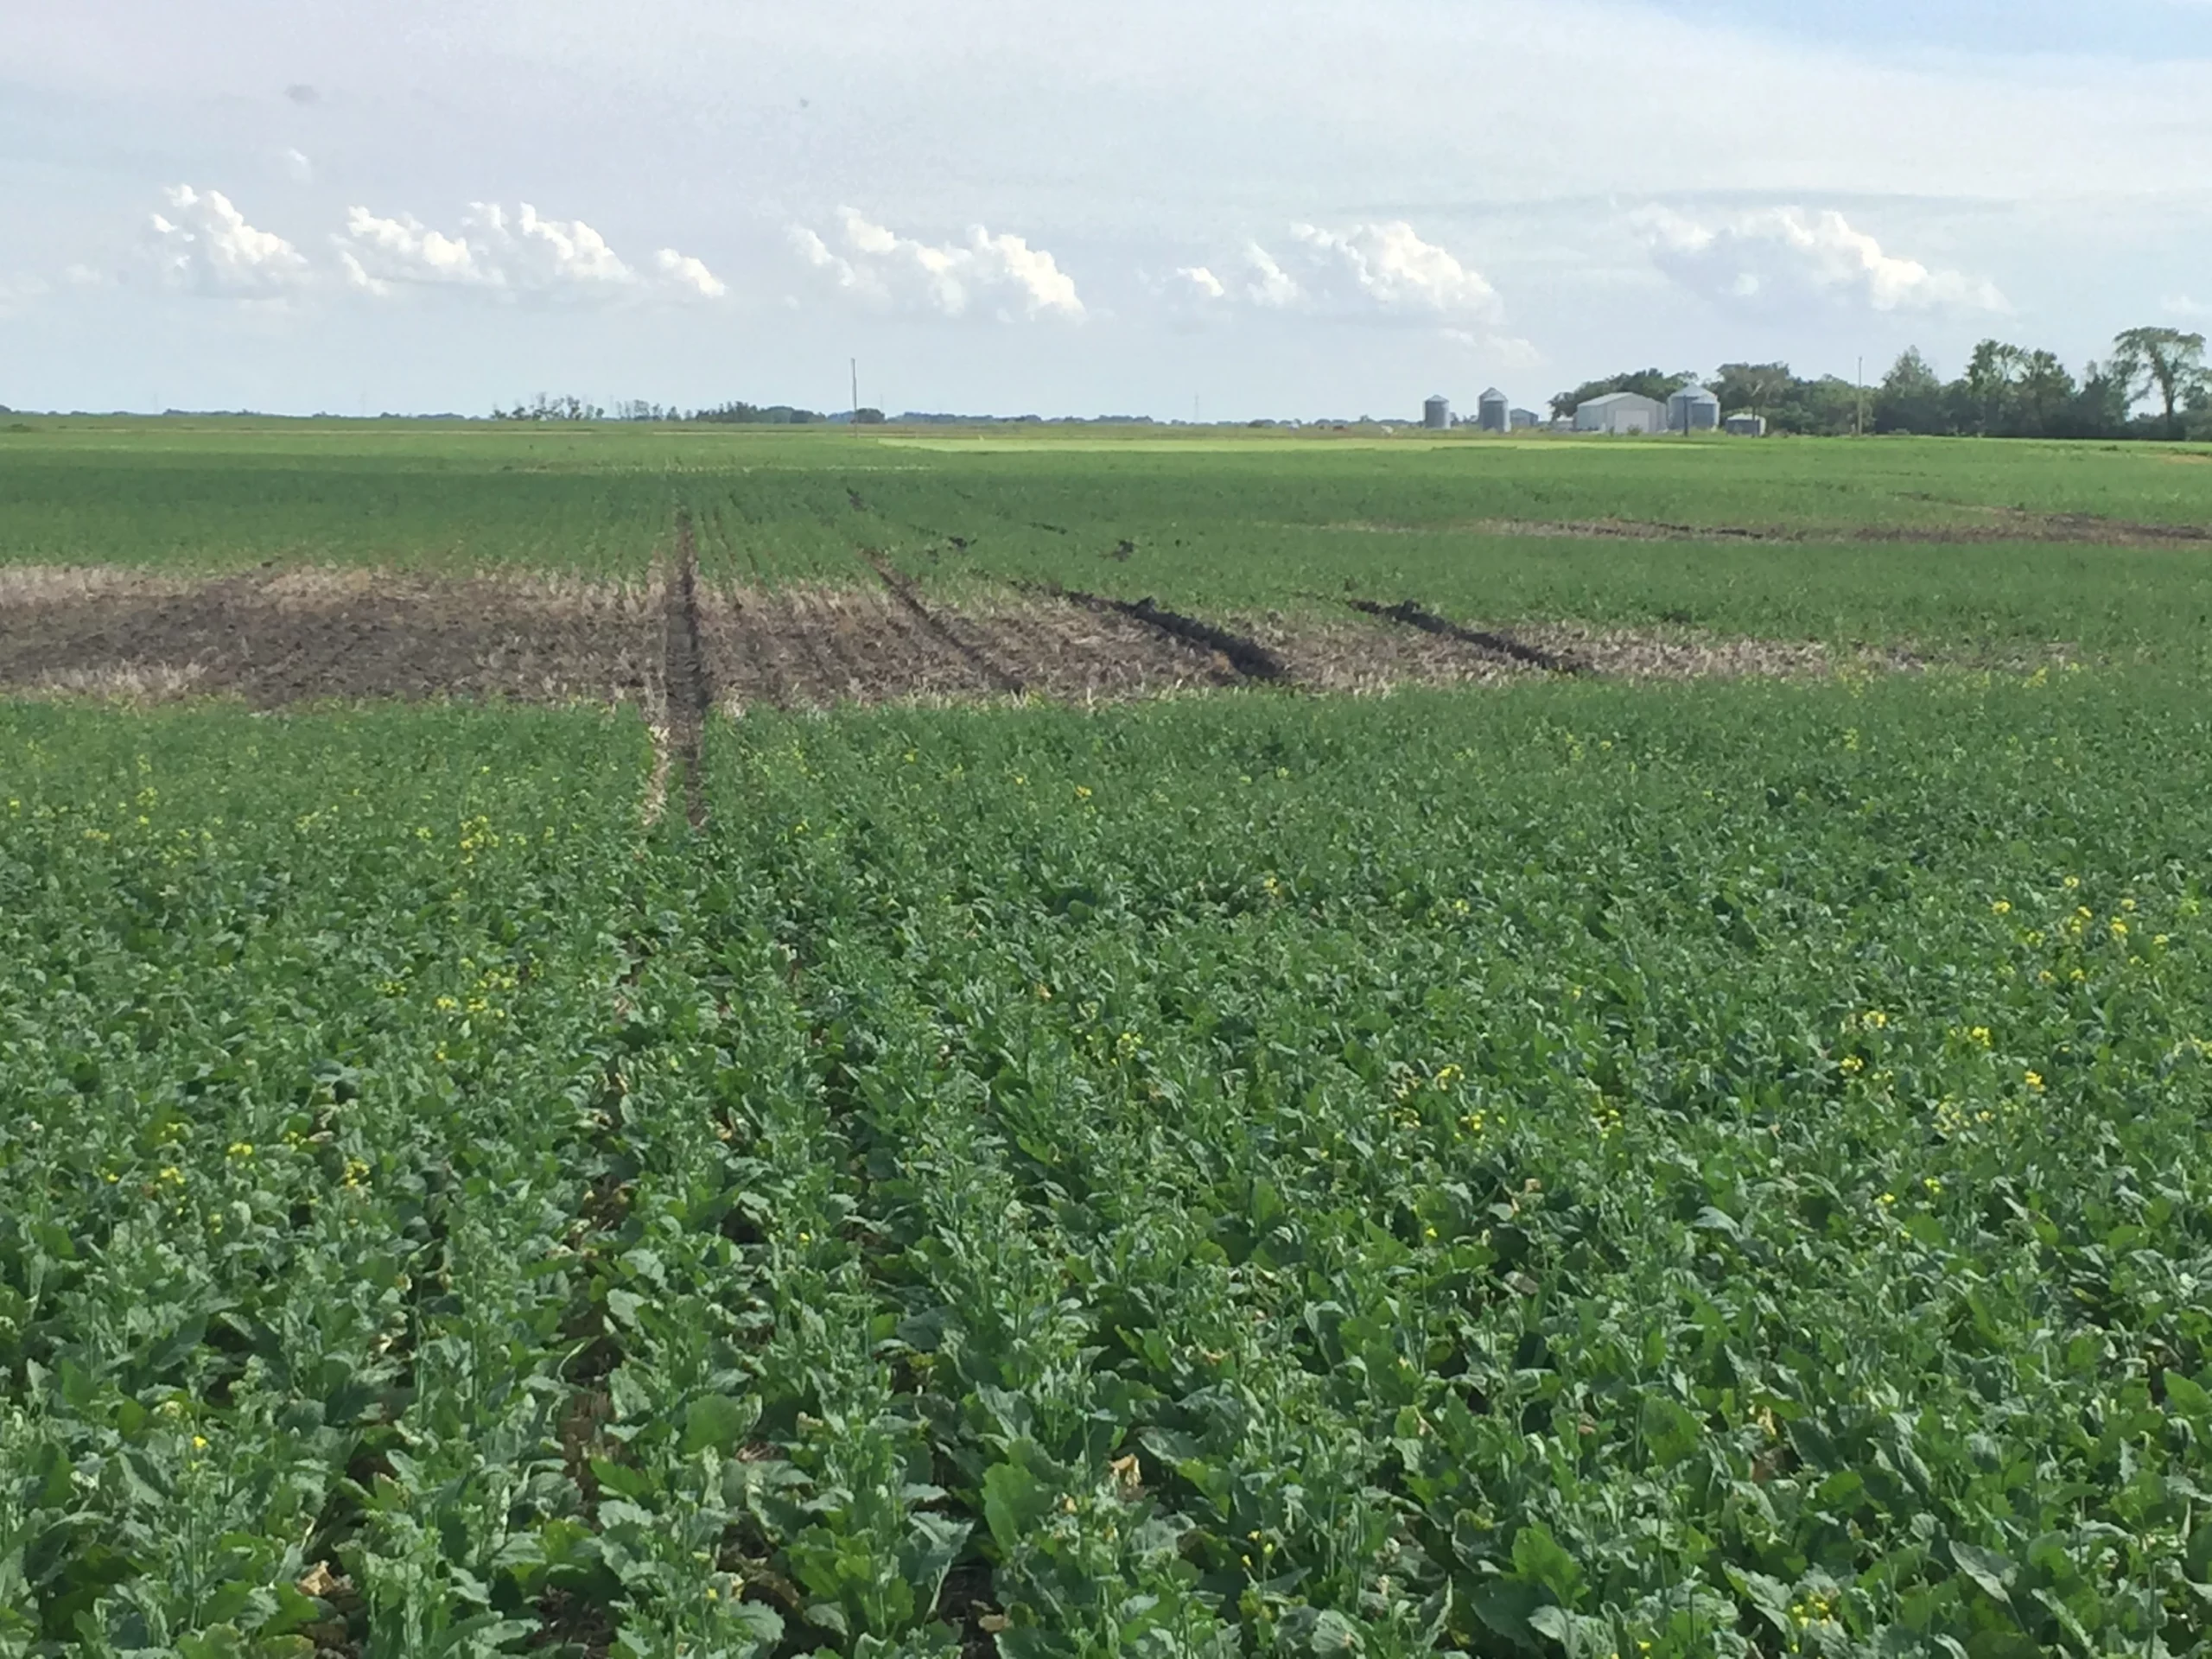
Even in December when fertilizer planning began, we knew there was going to be a high risk of flooded acres. In poorly drained soils with a full profile, a 2” rain when the crop is still young can be devastating, and that’s exactly what happened. Mid to late May seeded canola and barley took it particularly hard.
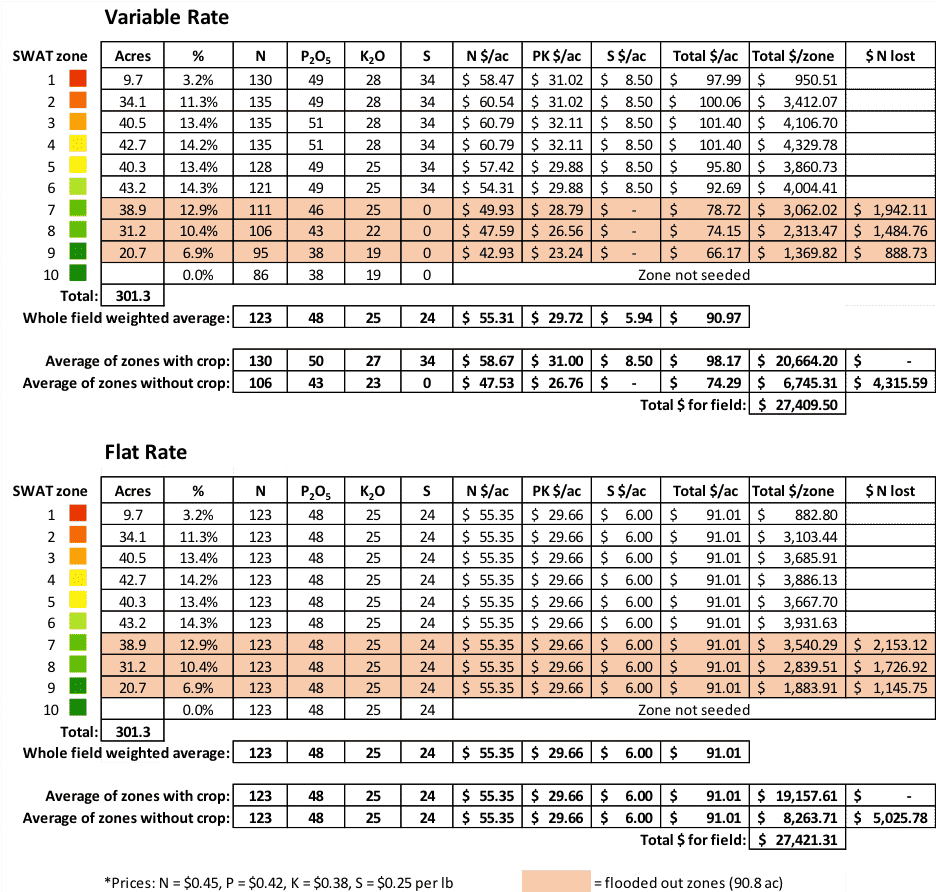
Below are two scenarios for canola; one is the actual VR scenario used and below it is a flat rate scenario using the same average inputs. Because of the soil test properties, stored soil moisture, and typical in-season rainfall we decided to “go for it” on the upper zones, with the highest rates of fertilizer being applied on upper landscape positions (SWAT zones 1-4). Rates were pulled back gradually with the rates in zone 10 (which are high organic matter, muck soils) being quite low. As it turned out, much of zone 10 wasn’t even able to be seeded, so I removed that zone from the analysis completely. So on about 301 seeded acres, there was approximately 91 acres flooded out, primarily SWAT zones 7, 8, and 9. There will likely be some 70+ bu canola in SWAT zones 1-3, but the average won’t be so shiny!
The main “bottom line” differences at this point in the season are this:
1. Using SWAT VR there was about $1518 less fertilizer invested in parts of the field that will grow nothing, compared to flat rate. $710 of this was nitrogen, which will almost surely be lost to denitrification, while the P,K, and elemental S will still be in the soil “bank account”. If this was a short term rental that won’t be farmed next year, you can kiss the whole amount goodbye.
2. The zones with crop have an average of 7-2-2-10 more actual nutrients per acre, which in this high rainfall scenario will almost surely result in additional yield response. In canola a realistic expectation would be an additional 2-3 bu/ac with this.
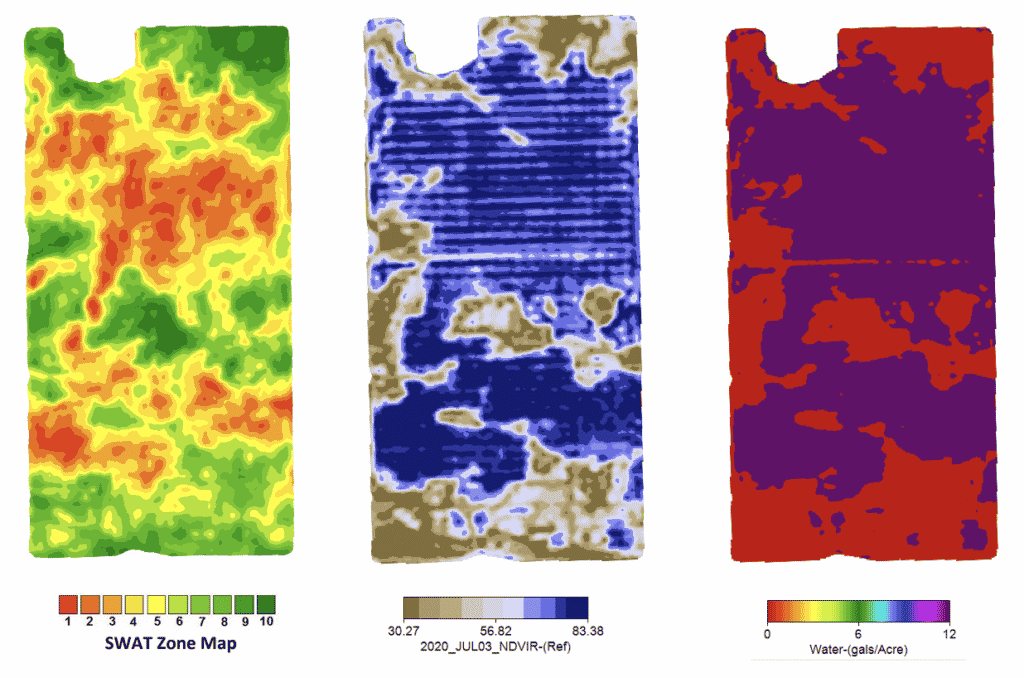
Additional value from precision ag tools was gained at fungicide timing. We were able to obtain good NDVI images prior to flowering and a simple on/off prescription was produced, spraying only 191 acres out of 311 total (61% of the field). While some of it could have been managed “manually” with switches on this particular field, it would be impossible to match the preciseness of the prescription paired with sectional nozzle control.
So what’s the value of SWAT Maps variable rate? Without multiple flat rate check strips and measuring yield by zone it’s impossible to know, but at the moment we see immediate value of more nutrients put into crop rather than lost, and if that does in fact translate to more yield, the additional revenue balloons quickly even with a modest yield increase. And we didn’t even get into topdressing areas with increased potential… perhaps more on that in another post.
Wes Anderson
Global Fertility Specialist
wes@croprecords.com

Become a SWAT News insider!
Sign Me Up!
Join Our Mailing List
Enter your email below to sign up for our mailing list.
We care about the protection of your data. We’ll never share your details.
Croptimistic Technology Inc. is an international agriculture technology (AgTech) company. We began operating in 2018. Croptimistic is supported by a growing team of professionals who have dedicated their careers to developing the best soil mapping software and hardware in the world.
Copyright Croptimistic Technology Inc. © 2024 All Rights Reserved.
Privacy Policy
