0
$0.00
0 items

With yield mapping and NDVI imagery so widely available now it’s not difficult for us as agronomists or farmers to recognize there is yield variability in fields. The difficult question is why? Are some areas too dry? Too wet? Saline? P limited? Excess N causing lodging? Sodic soils?... the list is almost endless. There are also temporal factors that affect yield, such as weed patches, gophers, cutworms, etc. But if we are going to focus on variable rate nutrients or amendments applied to the soil, we need to focus on soil variability. And more importantly, be able to delineate different areas of a field by fertilizer responsiveness and soil characteristics, both physical and chemical.
Fortunately, SWAT MAPS does this. By using a combination of electrical conductivity, elevation, topography, and water flow, it is a powerful tool to delineate a field into various management zones with similar fertilizer response characteristics and yield limiting factors. This is not easy! Every field is different and has different factors affecting the variability that is present. Some fields have variability dominated by topography. In others, EC (texture and/or salinity) is a bigger factor. It simply depends on the landscape and my hours spent ground-truthing maps has told me to never assume anything until your boots are on the ground and you have quality data in front of you.
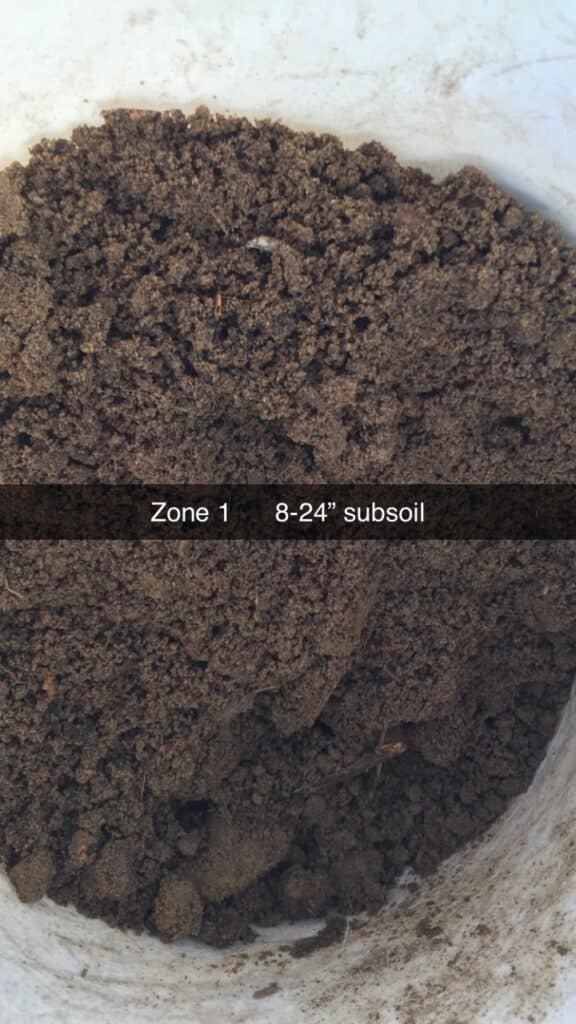
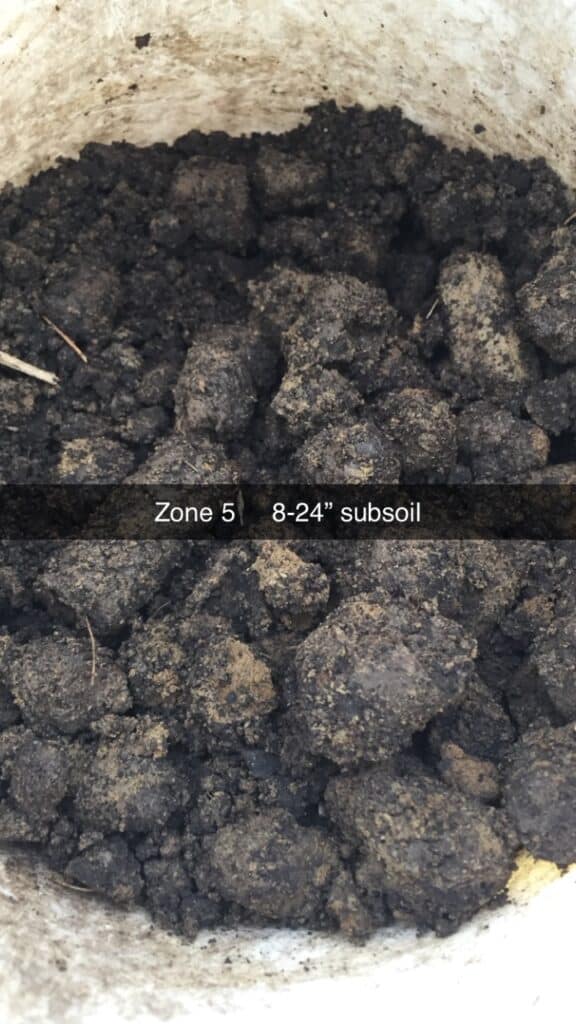
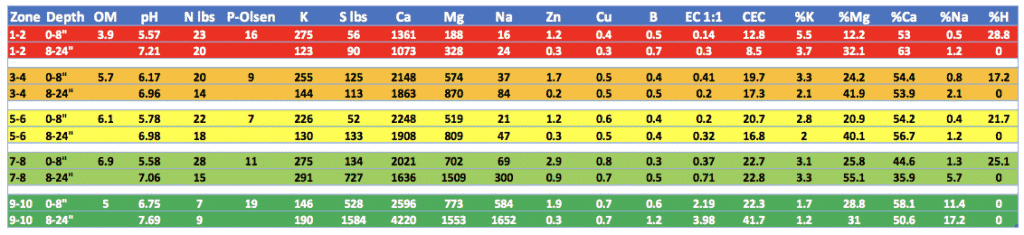
For example, what’s the limiting factors in the field below from NE Alberta? In zones 1 and 2, I’d argue pH, Cu, and water holding capacity are significant. But in this higher rainfall area they can grow good crop if managed well. In zones 3 to 6 the biggest problem might just be phosphate. In zones 7 and 8, not many issues at all other than low pH, but these zones likely produce well every year (this is a common theme in SWAT mapped fields, but that’s another article for another day…). Zone 10 on the other hand, is saline and high in sodium, often too wet, has little chance of producing a crop and can therefore be managed accordingly.
The point is, it’s relatively easy to see why the high yielding areas are high yielding. The difficult part is sorting out all the reasons why areas are low or average yielding. If I was to zone this field based on NDVI, I would likely make the mistake of having areas in zone 9 or 10 zoned the same as zone 1, or maybe a large patch with wild oats in zone 7 with zone 1. If I combined soil tests from those areas what would I find? Nothing!... or at least nothing useful since it would be an average of very different soils. But once you can map the soil potential accurately, it can be measured and managed for higher yields and better profitability. And isn’t that the whole point of this?
My final comment: yield maps and NDVI are fantastic tools for telling us where there is variability and can be very useful for applying inputs in crop– for example top dressing, growth regulators, or fungicide. But they have no ability to tell us why an area is poor. And to be able to fix yield limiting areas, we simply need to know the “why”.