Benefits of SWAT MAPS: Water, Nitrogen, and Technology
In the last post I discussed some thoughts about nitrogen dynamics by landscape position mainly focused around the effects of organic matter differences and mineralization. But once fertilizer is applied or nitrogen is mineralized and available in nitrate form, what then? Nitrate-N is susceptible to leaching in coarse textured soils, and denitrification in saturated soils. So how could a SWAT MAP help us manage the risk of N loss even further?
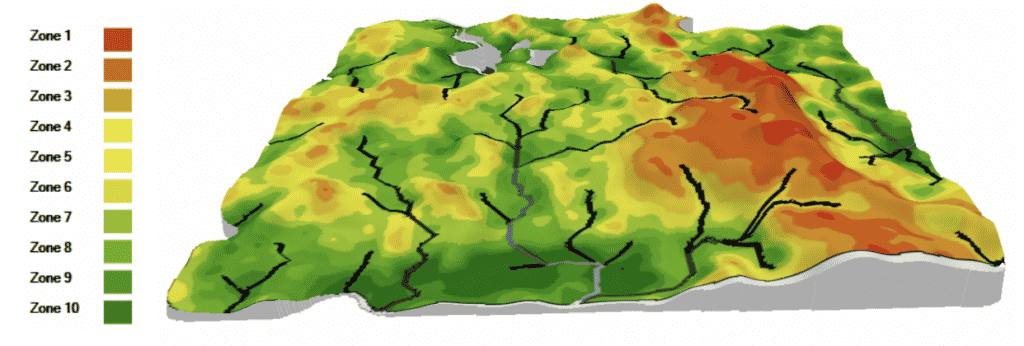
Since topography and water modelling are major components of the SWAT MAP, we know exactly where water flows through a field and collects. In the field shown in Figure 1, the dark green zone 10s will be holding water or be very saturated in early spring after snow melt, or even in season after heavy rainfalls. In other areas with less topography (i.e. Regina plains), a wet year may saturate zones 7-10, resulting in very large areas flooding like in 2010/11. If we know where water will collect, we know where nitrogen will have the highest chance of loss. This is supported by landscape based research in western Canada (Elliott, J.A. and de Jong, E., 1992).

Our nitrogen fertilizer market in Canada has evolved over that last 20 years to include several technologies designed to protect nitrogen from loss. ESN®, SuperU®, and Agrotain® have all become commonly recognized names, yet are often confused with each other as being designed to serve the same purpose. To add to the confusion, there is a long list of nitrification and urease inhibitor “additives” available that are very similar. ESN still remains unique as the only polymer coated urea in Canada. All these products do exactly what they are designed to do – protect nitrogen from losses, although they do differ in what form of loss they protect from, the length of time they provide protection, and therefore what situations they should be used. I’ll focus on how a product like ESN or a nitrification inhibitor (ie. SuperU or N-Serve®) can be used in conjunction with a SWAT MAP for better ROI.
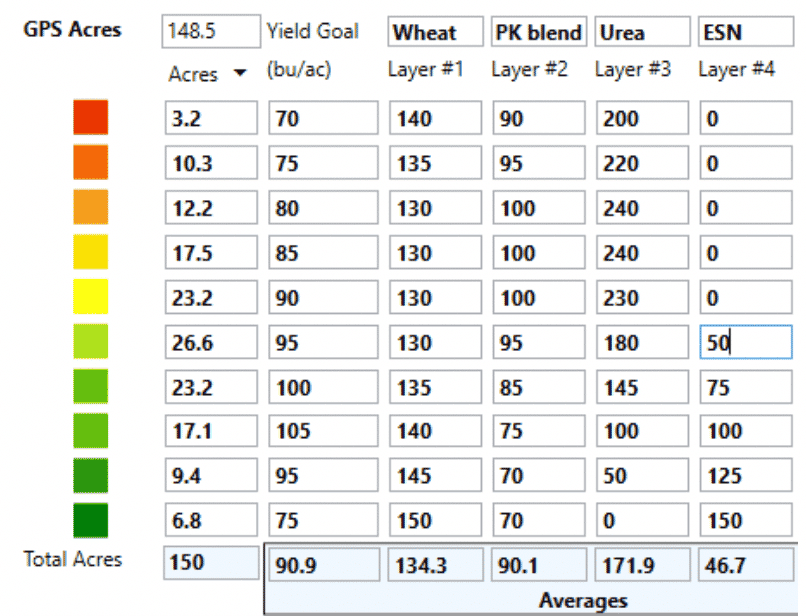
The strategy with any of these products is fundamentally the same – as we move downslope, the chance of loss due to denitrification is highest and the need for protected nitrogen is higher. A prescription could be written where urea is the primary source of N in zones 1-7, but it transitions to ESN in zones 6-10, as shown in figure 2 where each column represents a tank in the air drill and each row represents the rates of product in each zone. SuperU could also be used the same way, depending on the situation.

We could also write an “on/off” prescription for a Raven Sidekick Pro™ holding N-Serve, where it is only injected in zones 7-10 with NH3, for example. In both these situations, you’d get most of the benefit of protecting from denitrification loss for a fraction of the cost (note field average rates of urea and ESN at the bottom of each column). These examples are just one way we can use SWAT MAPS for economic and environmental benefit. Not every farm will have the logistical capability to do this, but where it is possible, it can make a lot of sense.
In the next post, since it’s spraying season, I’m going to switch things up and discuss how a SWAT MAP can help with weed control!
Wes Anderson, PAg
Senior Fertility Specialist - Croptimistic Technology Inc.
wes@croprecords.com
References:
Elliott J. A. and de Jong, E. 1992. Quantifying denitrification on a field scale in hummocky terrain. Can. J. Soil Sci. 72:21-29.


