Consultant Feature: Niki Beingessner - Synergy AG

Meet agronomist and SWAT MAPS consultant Niki Beingessner from Synergy AG, based out of Lewvan, SK. She has been providing SWAT MAPS for two years to clients southeast of Regina, SK. “SWAT MAPS is a communication tool between my clients and I and the soil,” Beingessner says. “If you see an issue somewhere, it’s easy to go and look at the maps and see where the issue might arise and how you can address it and make those areas more profitable. SWAT MAPS help us to put the dollars where they are going to matter the most. It might not save you money on fertilizer but it makes you more strategic with your inputs so you will see a better return.”
Speaking of the area that she services, southeast of Regina, Beingessner comments, “Salinity is a big issue. It’s important to manage your plant stand counts and maturity as well. We don’t have a huge amount of variability in this area, so I think it’s vital just to manage maturity and put more dollars in more high-producing zones.”
Beingessner describes the SWAT MAPS process as a variety of layers that are combined to make a map specific to your farm and your field. “Layers such as topography and electrical conductivity, water flow, and so on are combined to make the maps and then we take soil samples of the field to better understand it. A SWAT MAP isn’t a yield map, or satellite imagery - it’s an actual boots-on-the-ground map. It doesn’t just tell you one thing about your field; it tells you many different things about it and the soil included.” Beingessner adds that she likes that the SWAT MAP doesn’t just provide you with one answer for one problem, but that it is situationally based. “If a field is more prone to salinity, you can use the map to gauge more towards that; whereas if there is an issue due to elevation, the SWAT MAP applies to that too.”

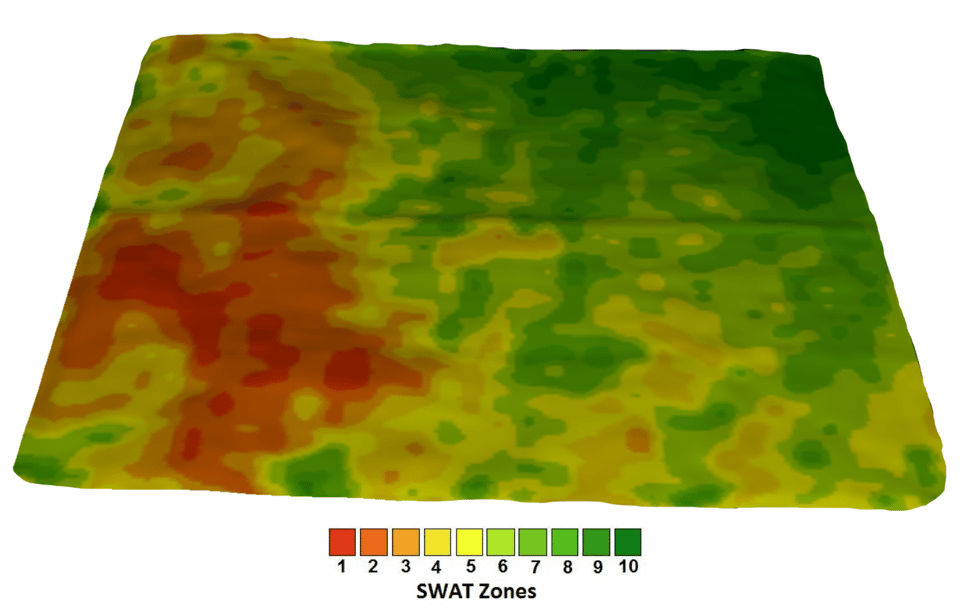
Beingessner goes on to share about a specific field that has been a challenge to her and her client (see above). “In zones 9-10 we have been finding the weed growth is very high. There is a pretty much a line down the middle of the field where the weeds are less, almost none. Just by looking at the map, it makes sense that zones 9-10 are probably very saline and weed growth can favour those areas. So that will be something to address in the next couple years. Also, this year it was an alfalfa/Clearfield canola intercrop, so that made it more of a challenge as well.” She notes that they haven’t yet tried SWAT MAPS for a herbicide application, but that it will be something they will use in this field in the future.
Beingessner concludes by praising the SWAT MAPS development team and support staff. “I have loved how easy it has been to get in touch with them and how responsive they are - it has been phenomenal. It makes the process that much easier.” Speaking of Synergy AG, Beingessner says, “We’ve done lots of talking at our company about variable rate and all the different packages that are out there. We feel for the dollar, SWAT MAPS just do that much more. They have all the pieces of the puzzle there. Lots of companies are missing key things – some don’t soil sample; some just use imagery or yield data. They’re missing the boots on the ground. With SWAT MAPS, they don’t just make the maps and send them to the grower. An agronomist like myself is there to check the maps and if something doesn’t make sense, we can confirm why that is. That’s why we choose SWAT MAPS.”
To work with Synergy AG, contact Niki at niki@synergy.ag.
Coral Blaikie, BAH
Marketing Manager - Croptimistic Technology Inc.
coral@croprecords.com


