How to Implement the SWAT MAPS Yield Potential Program to Maximize Your Potential and Cut Costs
Hana Ruf
Regional Manager, East Central SK
hana@swatmaps.com
SWAT MAPS variable rate technology is the first step in maximizing efficiency and productivity through fertilizer, seed, and soil amendments. Once a farm has been fully mapped and the client and their agronomist feel they have a solid fertility plan, they might be wondering what else they can do to improve their practices. The Yield Potential Program (YPP) is for SWAT MAPS clients who want to take their VR potential to the next level. Included in the YPP are unlimited in-season prescriptions, yield analysis, and SWAT CAM.
Unlimited In-Season Prescriptions
Unlimited in-season prescriptions can be made using the SWAT MAP itself, SWAT CAM maps, or NDVI satellite imagery. There are many uses for in-season prescriptions such as on/off or VR fungicides, herbicides, insecticides, plant growth regulators, top dressing, and desiccation/pre-harvest.
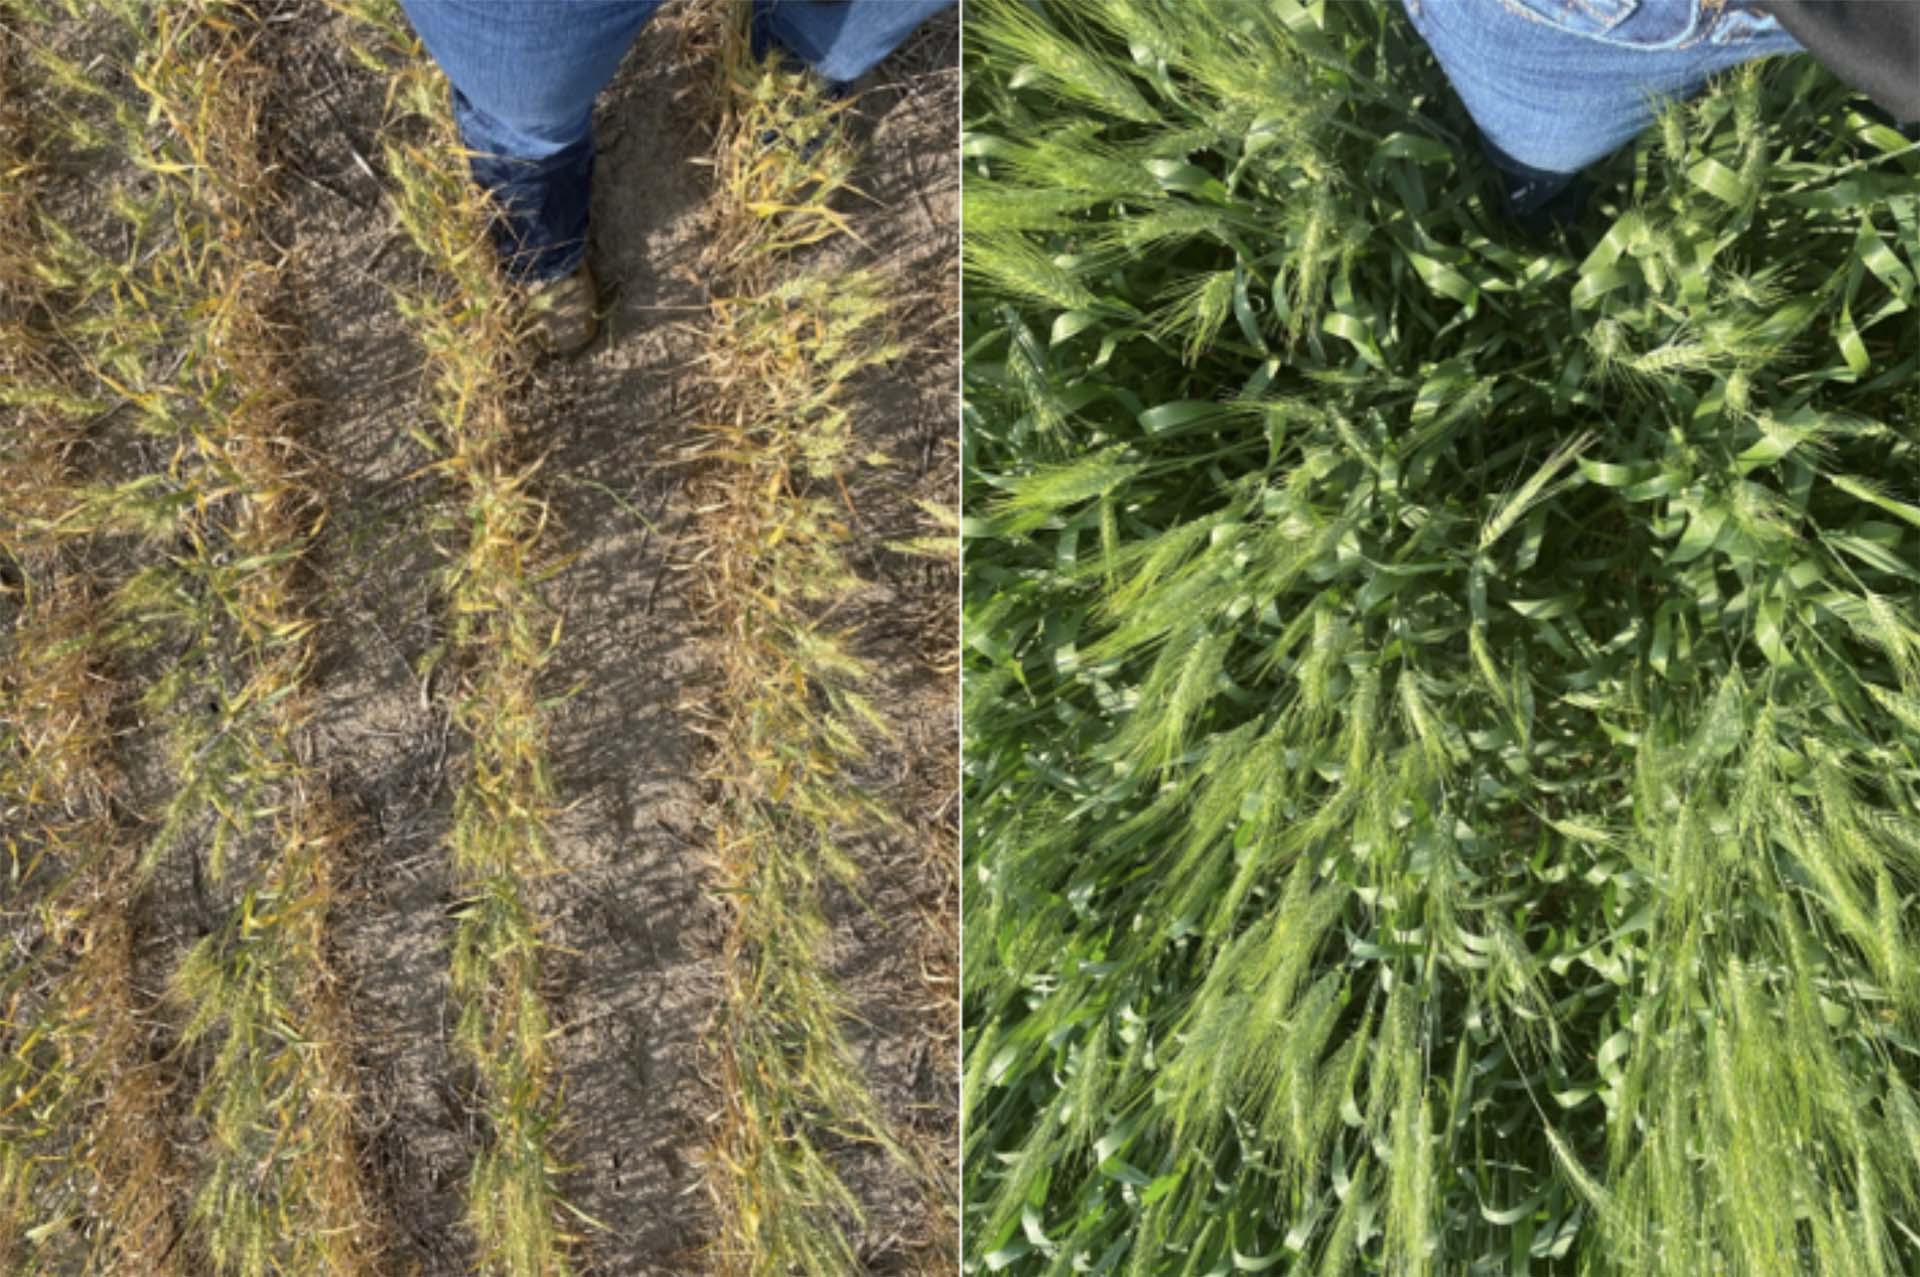
Figure 1 is an example of an on/off fungicide prescription that was applied by a ground sprayer using an NDVI map. In this case, areas of the field had minimal crop growth due to dry conditions and sandy soil, and in other areas due to high salinity. The fungicide was turned off in these areas (zones 8-10 on the NDVI map), saving the client $538 on this 150 acre field. If these in-season prescriptions were used across 5,000 acres and fungicide was turned off 20% of the time, in places where it is not needed, the savings alone would pay for the cost of the YPP subscription ($2/ac).

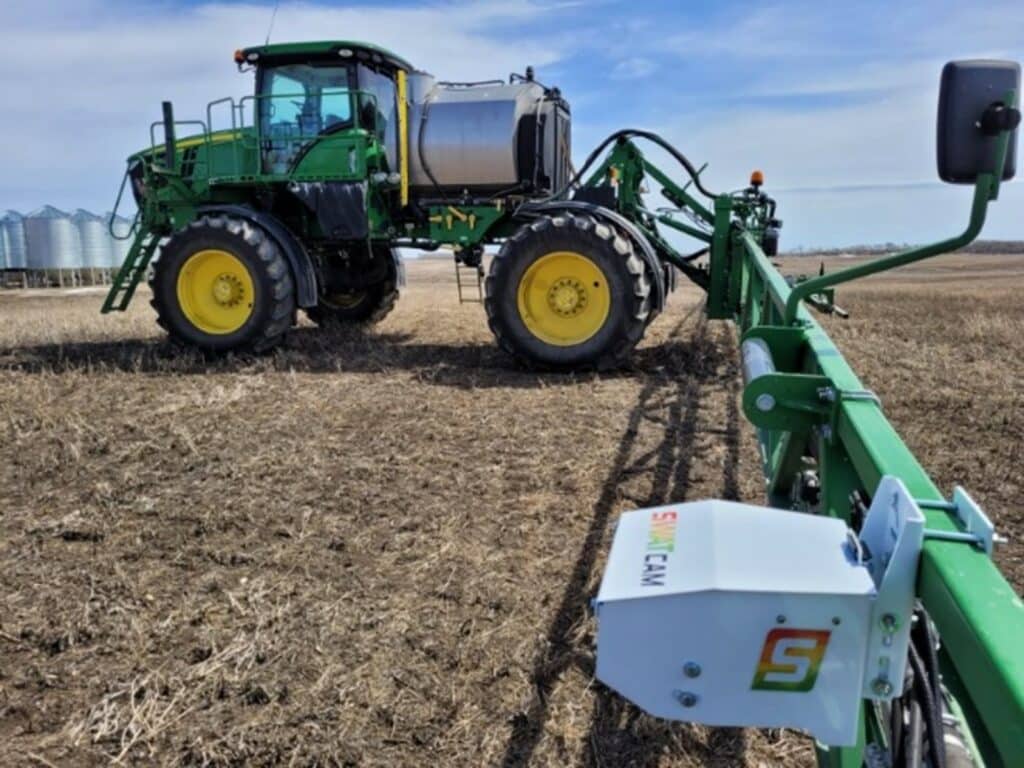
SWAT CAM
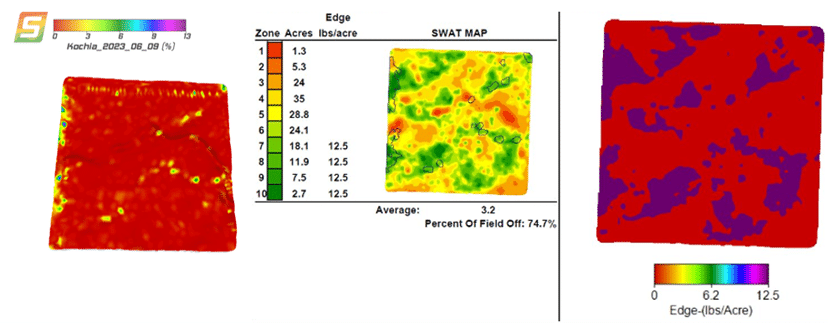
SWAT CAM maps are most often used for top-dressing and herbicide applications. One example of an easy way to save money using SWAT CAM is to target kochia with products such as Authority® (sulfentrazone) or Edge® (ethalfluralin). Figure 2 demonstrates a prescription that was used for an on/off Edge application based on both the SWAT MAP and the kochia map. The Edge is turned on in zones 7-10 on the SWAT MAP, as well as in any places where the SWAT CAM identified kochia plants to ensure good coverage. The Edge was turned off for 74.7% of this 160 acre field, saving $3935.
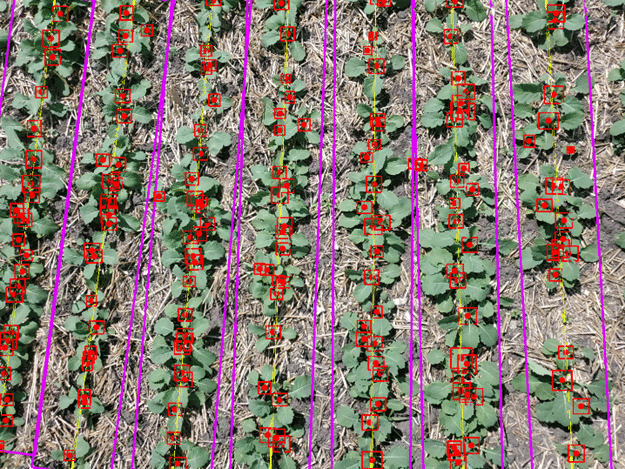
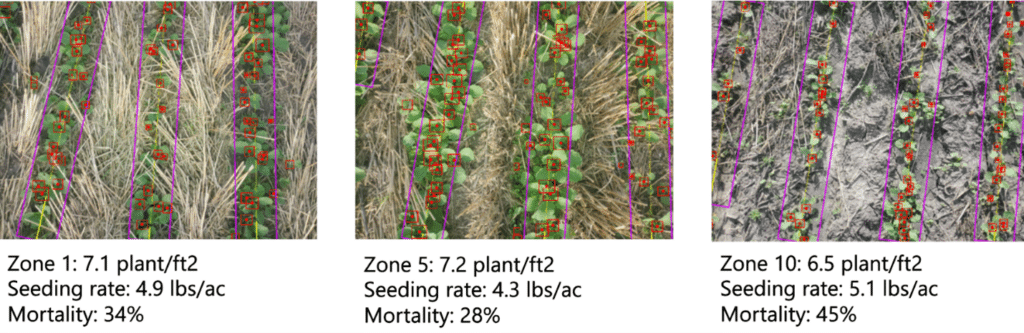
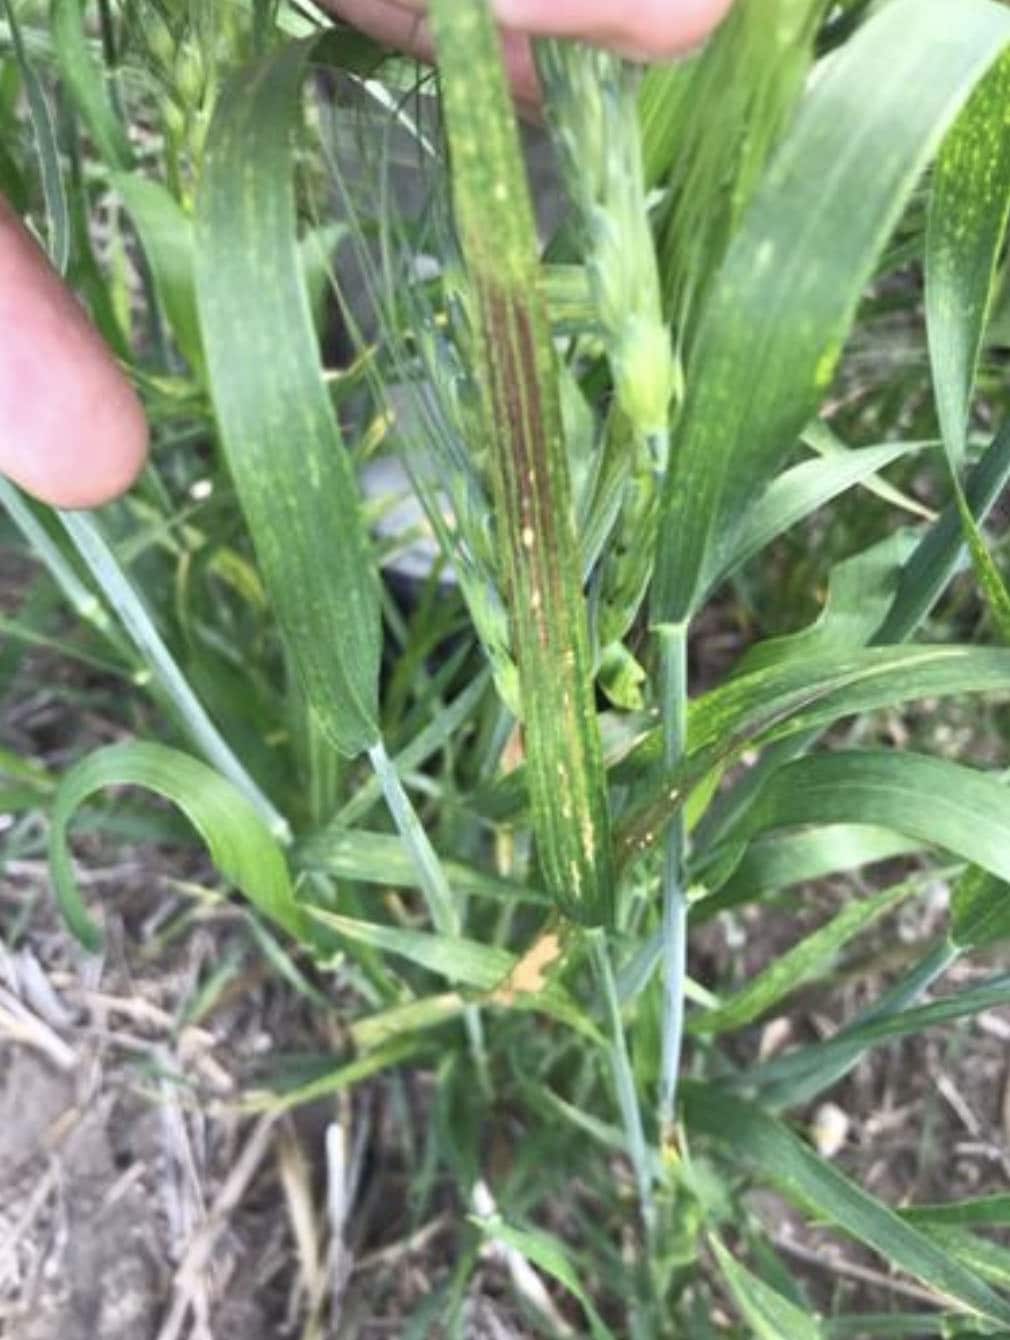
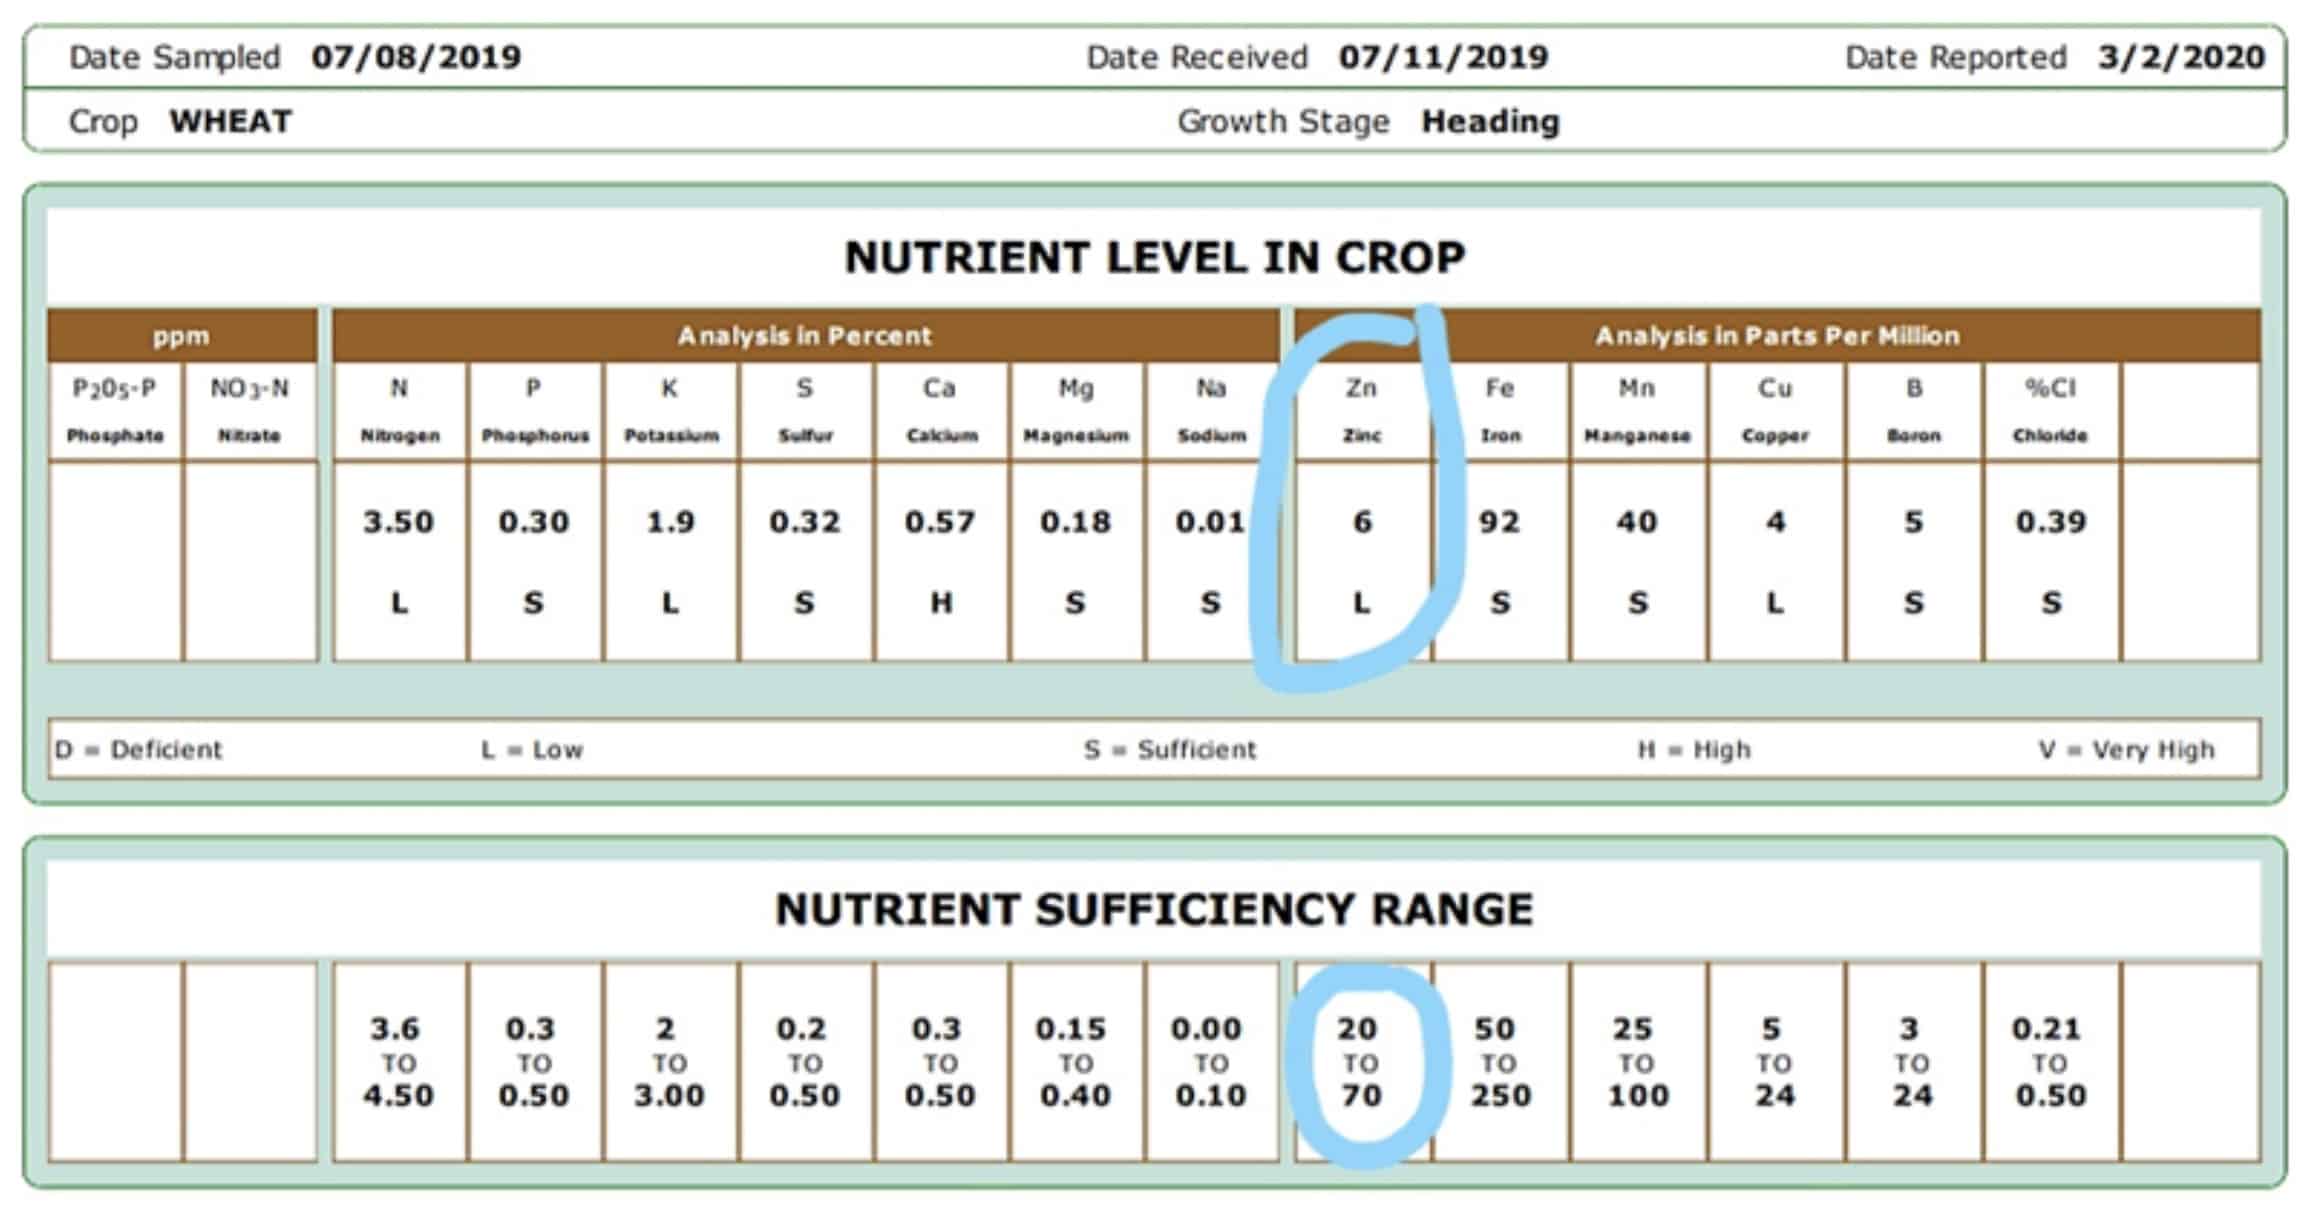
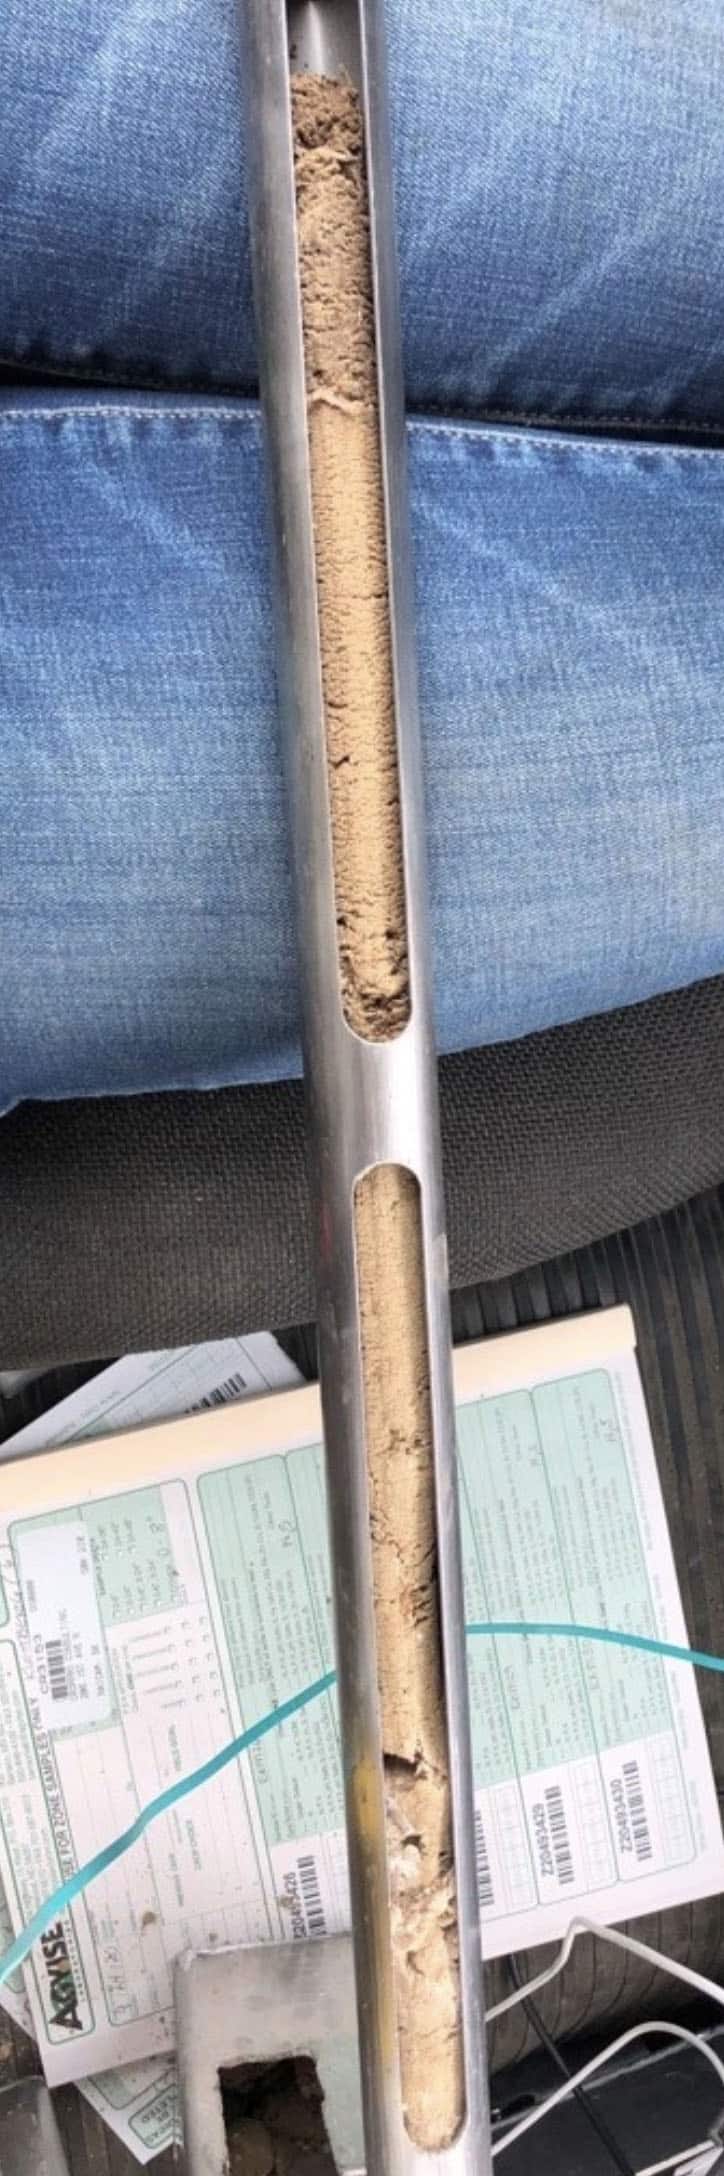
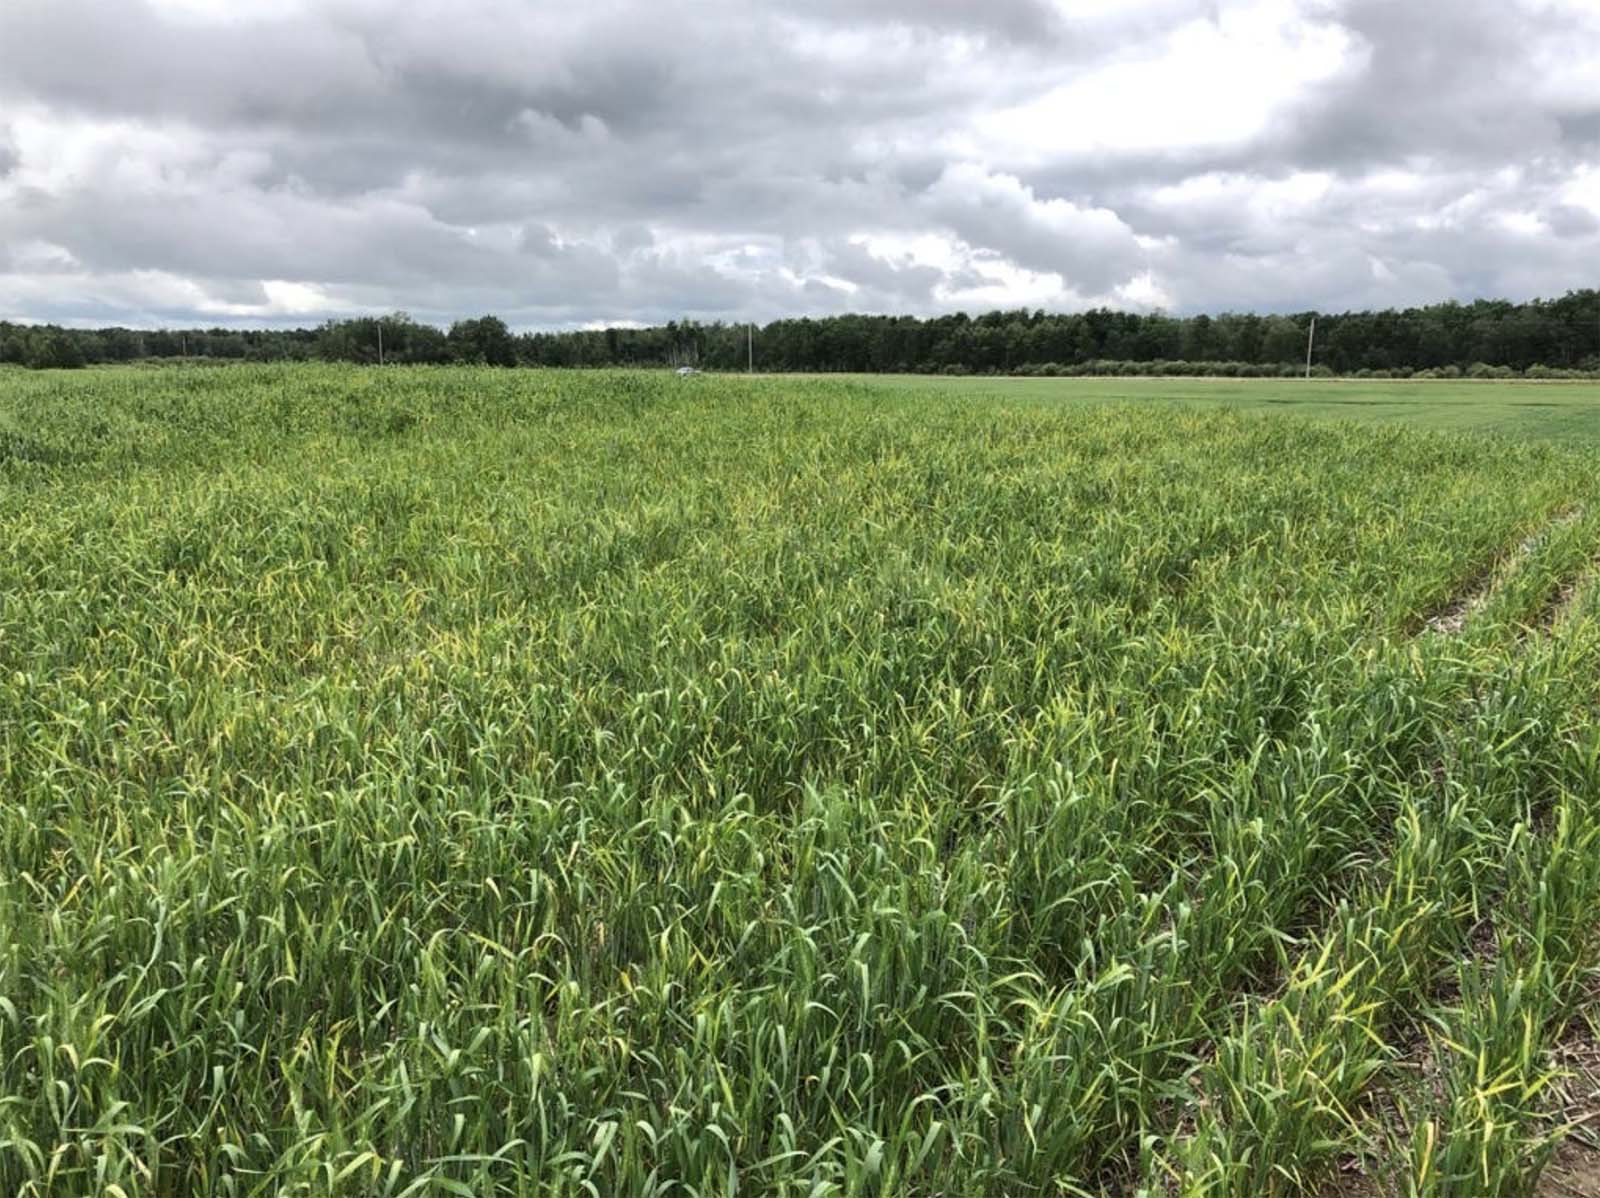
The SWAT CAM is also very useful for helping identify issues in a field such as nutrient deficiencies or drill issues. It is a useful tool for directing scouting efforts and checking on “problem” areas of a field. A quick reference to a SWAT CAM photo in a saline zone 10 can indicate how well the crop is growing there, and if you should adjust your seed or fertilizer rates there in future. The SWAT CAM provides clients and agronomists with unbiased, high resolution plant stand counts for canola, corn, soybeans, and potatoes. Future adjustments to seed rates can be made based on these plant stand counts.
Yield Data
As agronomists, we consider many factors when deciding what fertilizer rates to apply in each zone on a field. We use the SWAT MAP, soil tests, and general knowledge about the field and region to ensure we are not over or under applying seed or fertilizer. As a result, we see many benefits such as increased fertilizer efficiency, reduced lodging, more evenly maturing fields, and increased profitability. However, we are missing an important piece of the puzzle by not knowing exactly how our decisions within a field are affecting yield and ROI. At the end of the season, we don’t get a “report card” to know where the highs and lows were in a field or on a farm. In the YPP, client yield data is cleaned, analyzed, and used to fine tune our decisions going forward.
YPP provides useful data for each field such as actual yield by zone, yield vs. farm average by zone, multi-year yield % of average by zone, stability maps, and profitability maps and graphs. We have been successfully using these tools to identify where we are both overestimating and underestimating yield potential, whether on a zone scale or entire field scale.
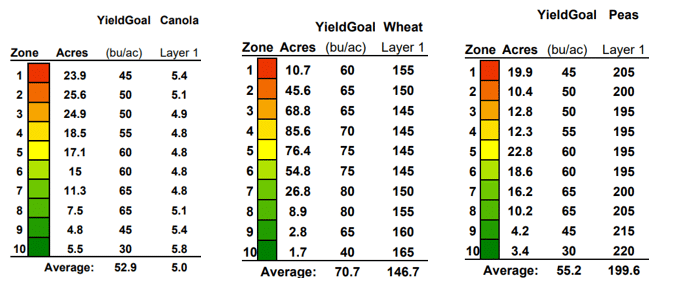
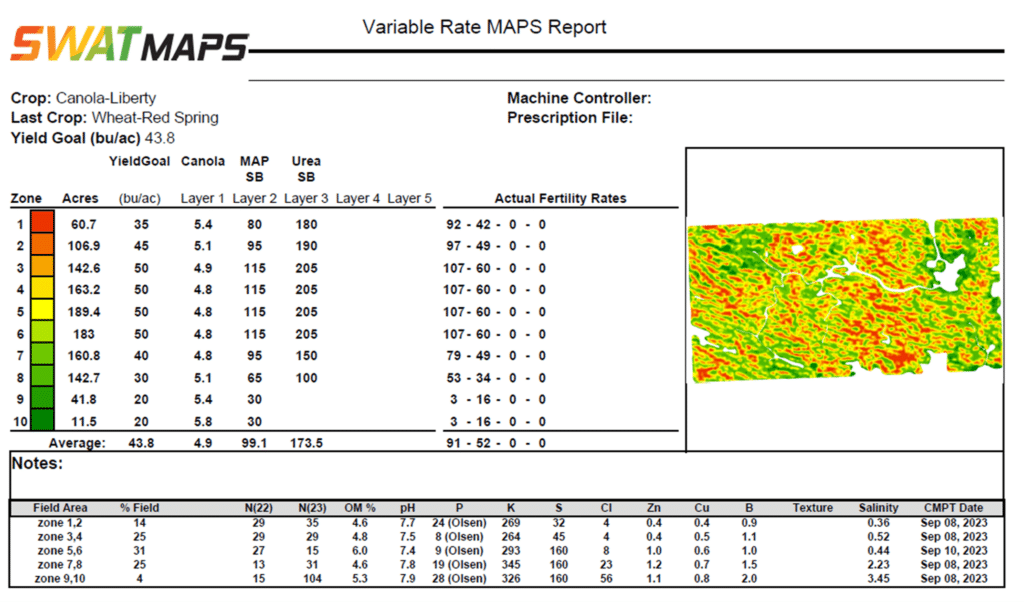
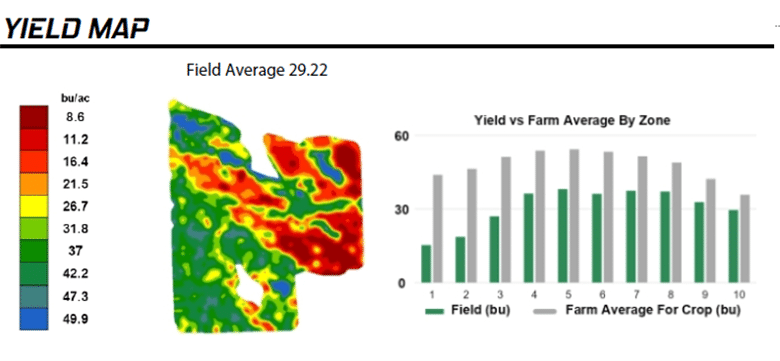
Figure 3 shows a field where we were continuously underestimating the yield potential of the entire field, especially in zones 1, 2, and 10. This was a common trend on this entire farm, so in 2024 we adjusted the yield goals (Table 1.) and fertilizer rates to try and achieve even greater yield in these areas. After a few years of doing this, we can gain confidence in just how much we can push these yields and know what our potential really is. This will allow us to maximize ROI by aiming for our maximum yield potential without overapplying fertilizer to achieve it.
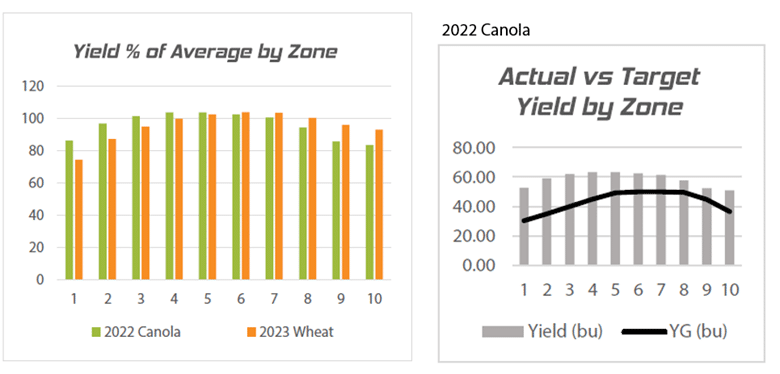
Table 1. Canola yield goal, actual yield, and adjusted yield goal for example field.
| Zone | Acres | Yield goal 2022 | Actual Yield 2022 | Yield Goal 2024 |
| 1 | 6.9 | 30 | 53 | 55 |
| 2 | 41.8 | 35 | 60 | 60 |
| 3 | 85.3 | 40 | 62 | 60 |
| 4 | 95.3 | 45 | 63 | 65 |
| 5 | 106.7 | 50 | 63 | 65 |
| 6 | 122.3 | 50 | 62 | 65 |
| 7 | 156.9 | 50 | 61 | 60 |
| 8 | 99.4 | 50 | 58 | 60 |
| 9 | 26.6 | 45 | 52 | 55 |
| 10 | 8.6 | 35 | 51 | 50 |
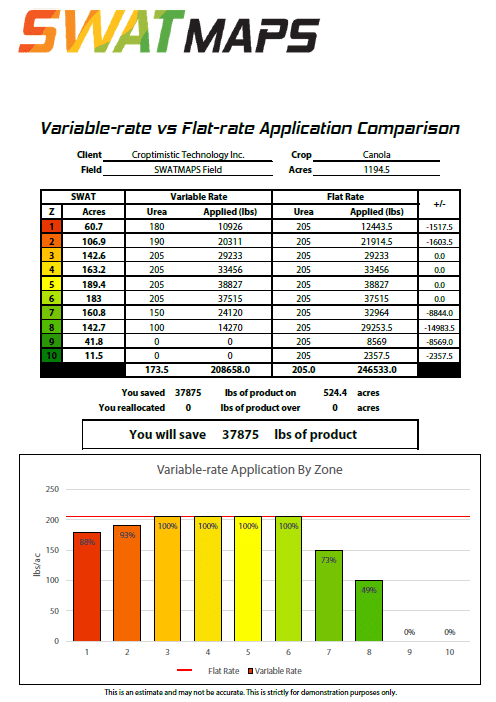
We might also identify fields or zones in which we are overestimating the yield potential. The field in Figure 4 is a poor yielding field historically and has a very sandy zone 1 and 2. When we looked at the actual vs. target yield for each year, we were always well below our target in these zones and on the field average. We knew the yield was poor in zones 1 and 2 and did adjust the yield goals and fertility for that, but we were still overestimating the yield potential even in years with adequate rainfall. Looking at the yield vs. farm average by zone and seeing how poor this field performs compared to the rest of the farm, we decided since this is a higher risk field we might be better off scaling back the fertilizer and yield goals and allocating that budget to better performing areas on the farm. This will help mitigate the risk and manage inputs properly.
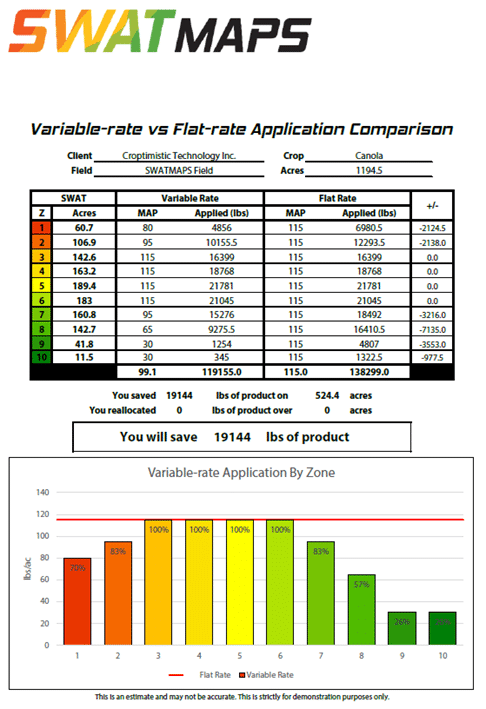
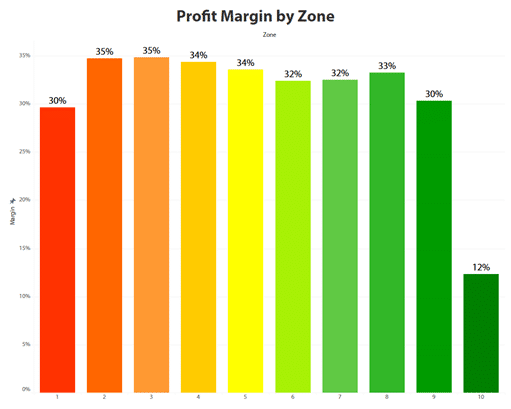
Clients can provide their input costs and selling prices to attain profitability maps and analysis through the YPP. This can help us improve margins and increase profitability both in good producing zones and troublesome zones. Zones 6 and 7 in the field in Figure 5 are at 32% of the profit margin (profit margin = profit/income). The yield data analysis provides this information, and then the client and agronomist can determine the “why.” We might be able to use SWAT CAM images to provide us with more information. We can then decide if there is a way to increase these margins. Is the solution in the seed or fertilizer rates? Do we need better drainage? If the profit margin in zones 6 and 7 can be increased by 2%, that would be an additional $30/ac. At 160 acres, that is $4800.
Summary
There are many use cases for the Yield Potential Program. Unlimited in-season prescriptions provide clients with an efficient and cost reducing alternative for applying pesticides. SWAT CAM provides options for directing scouting efforts, diagnosing and assessing issues in a field, and unbiased plant stand counts. The yield analysis component has many benefits which all help to fine-tune seed and fertilizer management and improve profitability.
For more information or to sign up for the Yield Potential Program, call 1-800-421-4099 today!