How Do I Choose the Right Variable Rate Program?
Chris Hawkins
Director of Sales – Farmer Services
In agriculture today where risk is high and profit margins can become quite thin, variable rate (VR) application programs have emerged as indispensable tools. They allow farmers to optimize input use, enhance crop yields, and maximize profitability, while at the same time minimizing environmental impact. However, with many VR programs and service providers available, farmers face the challenge of selecting the right system for their unique needs.
Here are some essential factors that farmers should consider before deciding on a VR program and service provider:
1. Establish Your Objective: There are many reasons why farmers utilize VR application. Increased yield, better pesticide application timing, and improved harvestability are just a few. Decide what problem you are attempting to solve with VR on your farm and find a service provider who will work with you to accomplish that.
2. Hardware Compatibility: Of course, you will need to make sure your own equipment is capable of, and ready to, apply VR prescriptions. Check with your equipment dealer on that. If it is “ready”, make sure your service provider can write prescriptions that will be compatible with your hardware because prescription files often need to be written specifically to match various types of controllers.
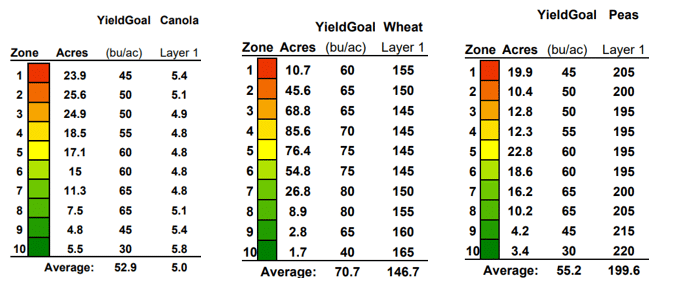
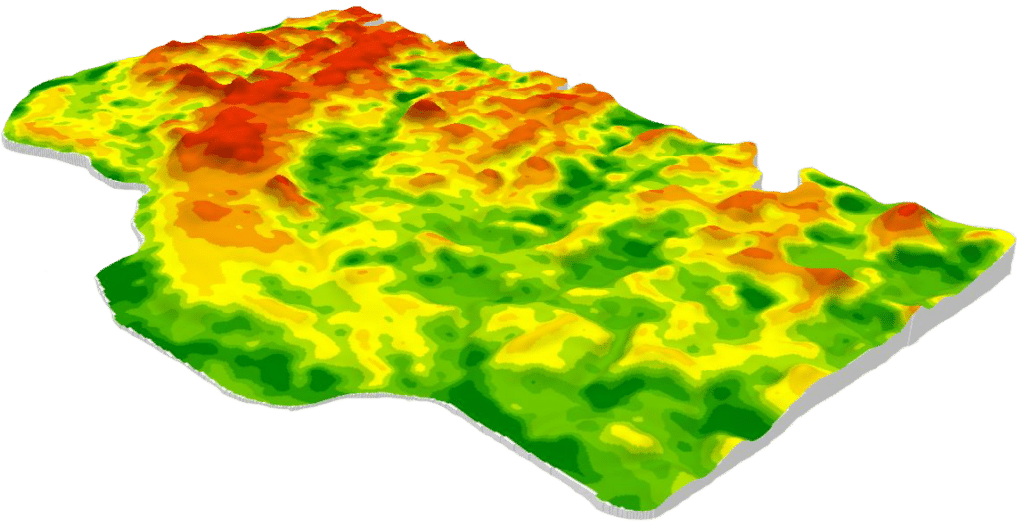
3. Field Variability (Zones): Many factors can influence variability within a field, and we have tools today to make field zone maps based on ALL of those factors at once (ie. satellite imagery, yield monitors, etc). Generally, these are a good view of “what” variability exists at a specific time (both spatial and temporal variability). However, great VR programs build zone maps based primarily on spatial factors such as soil, water dynamics, and topography (see figure 1). These stable characteristics are an ideal foundation for understanding “why” variability exists in any season.
4. Ground Truthing and Zone Sampling: Make sure your service provider incorporates ground truthing when building the zone maps for your VR program. Ground truthing is the process of comparing what an agronomist sees in a field with their own eyes to the field data that was collected. In this way, the most accurate map possible is chosen as a template for soil sampling. A proper variable rate program includes soil analysis from the same points each year by zone so the agronomist can make precise recommendations based on nutrient changes from year to year.
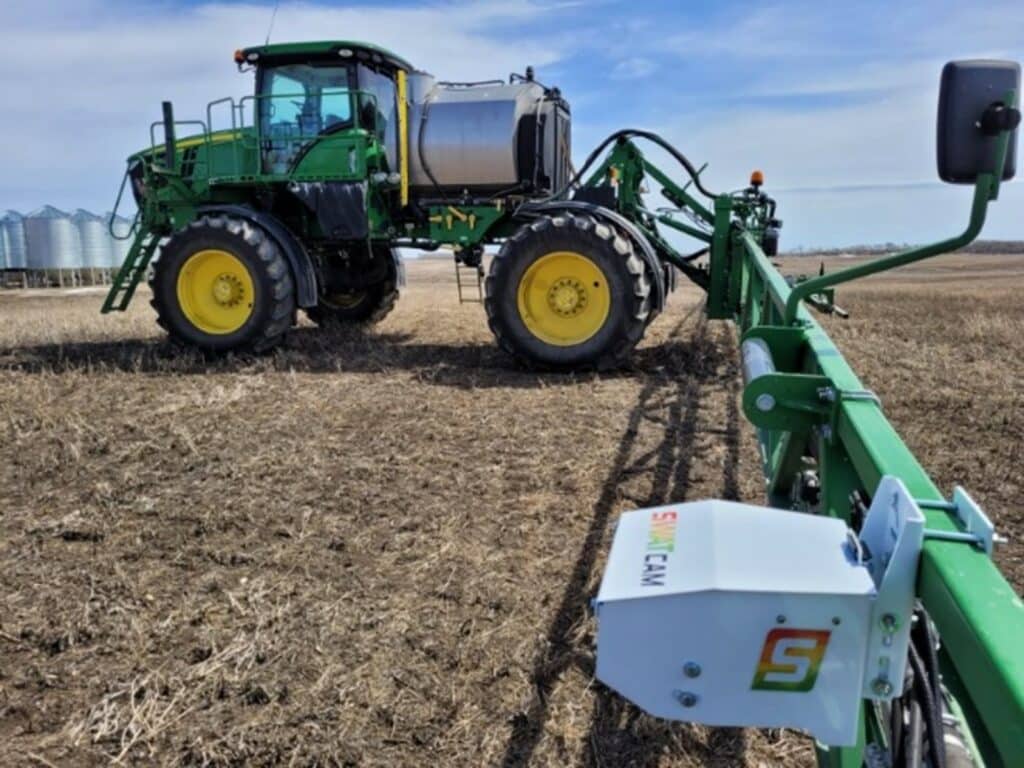
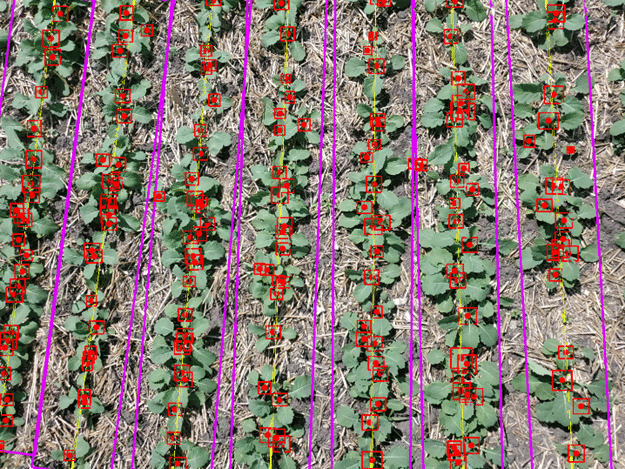
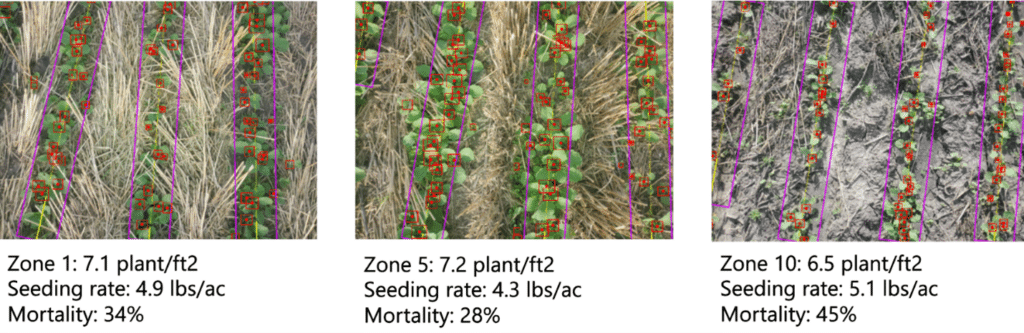
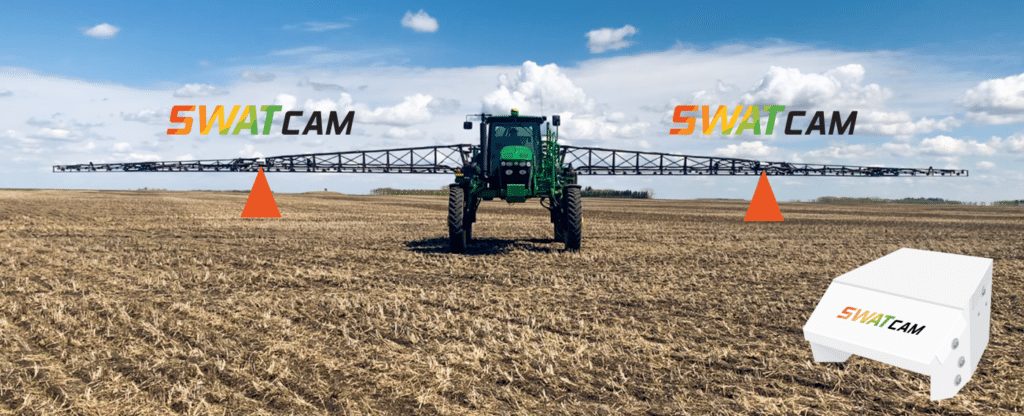
5. Scalability: Consider whether the VR service provider can scale with your operation as it grows. The best service providers are innovative and grow with you as they develop and incorporate new technology into their existing programs making their clients even more profitable. In figure 2 below you can see just one example of such technology. SWAT CAM can help to significantly reduce pesticide costs.
6. Ease of Use: Development of a good variable rate program can be quite complex, however for the farmer, it should be relatively easy to use. The service provider should handle the complexity so you can focus on other aspects of your farm.
7. Support and Training: Assess the level of support and training provided by the service provider to ensure successful implementation and troubleshooting. Support should be accessible especially in the peak seasons of work. The company should have both live people to speak with as well as online support.
8. Cost/Benefit: When analysing cost/benefit of a variable rate program, look beyond just one year. Sometimes the upfront cost of VR systems may be higher in the first year, but significantly lower in the following years. Further to that, Return on Investment (ROI) is tricky to measure because it is farm specific. It's easy to look at yield alone because that's tangible. However, yield is influenced by many different factors so it should not be the sole measuring stick for the value of a VR program. There are other intrinsic benefits to consider, such as operational efficiency and grain quality. It's very difficult to measure the value of spraying your fungicide at just the right time, or minimizing lodging, but the value needs to be acknowledged.
9. Reputation: Look for a system that offers high accuracy and precision in data collection, analysis, and application. Research the reputation and track record of the service provider, including their experience in the precision agriculture industry. Seek recommendations from other farmers or agricultural professionals to gain insights into their experiences with the system and service provider.
10. Regulatory Compliance: Ensure the program complies with local regulations regarding pesticide and fertilizer application, data privacy, and environmental concerns.
In conclusion, choosing the right variable rate program and service provider is an important decision that can significantly impact the success of your farm. By carefully considering factors such as map development and soil sampling process, scalability, ease of use, support and training, cost/benefit, reputation, and regulatory compliance, you can make informed choices that align with your goals and objectives.
If you would like to learn more about our VR program which uses SWAT MAPS technology, or any of our new innovations (such as SWAT CAM), please connect with us at sales@swatmaps.com. Or you can find more information on our website at SWATMAPS.com.