SWAT MAPS for Corn: Strategies for a Productive Growing Season

Amber Knaggs, BSc., PAg.
Regional Manager, MB

I love corn. It’s a crop that just has a lot going on. In Western Canada, it usually means you have a planter, invested in equipment and a dryer, and you are ready for the long growing season. And when that combine and corn header is finally parked, and you were lucky enough to complete the field work, you quickly move into planning season.

This means the “off season” or “winter planning” season is upon us. But this thinking that all the decisions are made during a few months of the year is not true. There are a handful of ‘aha’ moments throughout the growing season that seem to bring reminders of lessons not learnt. Or just a change of weather that highlights an issue that wasn’t previously apparent.

So, during this planning season of looking at the paperwork at your desk or on your screen and trying to plan for the best next season, remember the basics and what happened as your ‘aha’ moments. A soil test and a SWAT MAP can be an essential part of your planning. Below are a few corn related examples.

Salinity and Corn

Corn requires sufficient water. Salinity causes germination issues and poor growth. Soil salinity affects water availability to the corn crop, and any water stress to the corn affects its potential.

Table 1. Percent yield reduction due to salts. (NDSU Extension, 2019)

Table 1 illustrates the wide range of salinity and % yield reduction in corn. 2 mmhos/cm can reduce yield by 10%. However, at 4 mmhos/cm, that number potentially jumps to 50% yield reduction. And 5.5 mmhos/cm is potentially 100% yield reduction due to salts. This illustrates how it is not enough to know an area is just saline but leads to the question of “how saline is it?”.  Is your soil (or zone) a 2 mmhos/cm or is your soil a 4 mmhos/cm? Or are those poor areas 5.5 or more? Some fields are just not suitable for corn – we can’t VR the population enough to account for zones that won’t thrive - these areas should be planted to some other more tolerant crop. It is crucial to have the most detailed information to make that decision.

Don’t forget the micros!

Accurate fertility is essential for proper crop development, yield, and profitability. Having good soil test data to guide these decisions is important. Here are a few micronutrients to keep in mind for your ‘aha’ moments.

Cu by zone
Low copper availability is affected by low %OM, high pH, and highly correlated to soil textures. In the SWAT soil sample below, we see a trend where copper is lowest in Zone 1 and increases to Zone 10. A soil test value of less than 0.3 ppm, and low %OM would be a red flag that copper may be an issue.

Tissue testing is often used to complement information from soil tests. The Zone 1 tested below has  a tissue nutrient level for Cu of 2 ppm which indicates it’s in the nutrient deficient range. The DRIS index value is -101 which indicates this nutrient is most limiting. When both the nutrient level and DRIS index are low, it strengthens the confidence that this nutrient is deficient in the plant.

Micronutrient issues are often patchy, and it may be difficult to decide if you will get a response to applying a micronutrient treatment. Is the crop you are growing responsive or more sensitive to that nutrient? Is one of the other macronutrients more limiting? Or is there more of that nutrient at depth? If the soil is testing below a critical level, that usually means there is a higher chance of response. Sometimes you must live through an ‘aha’ moment, to know that something like a micronutrient is the issue.

Zn by zone
Critical levels of nutrients change by crop. A critical level for zinc of 0.4ppm may be suitable for wheat or barley crops, but with corn that critical level moves to 1.0ppm. Zinc is usually highly stratified with little found in subsoil. Eroded knolls that have lost a lot of topsoil, and accordingly zinc, are at a higher risk of deficiency, especially when pH is high as well. The SWAT MAP soil test shows low Zn levels in Zone 1 and increasing to Zone 10.

The complimentary tissue sample from the Zone 1, shows a deficient Zn nutrient level in crop and a -99 DRIS index value. These tests indicate Zinc is deficient in the plant tested.

Rarely does an entire field require a recommendation for a micronutrient treatment, making it a great fit for VR application. If most of the field is not testing below critical levels, apply only to the areas where it’s more likely you will have a response and ROI.

VR populations with a SWAT MAP

VR populations can be a large part of the planning process as covered in this blog Corn, soybeans, and the ultimate SWAT VR planting strategy. In the following example from 2024, a Southern Manitoba farm, created a VR rate for the entire field, then added strips of lower population of 26,000 seeds/acre, and a higher population of 36,000 seeds/acre.

Yield data was supplied by the client and analyzed by zone.

The data from this year, indicates that statistically, there were differences found between the lower 24,000 plants/acre population and the VR rate on most zones except zone 1. And then, for the higher 36,000 plants/acre population, only zones 3 and 4 were not significantly different than the VR rate. The VR rate corn population had the highest average yield.

I would challenge farms to work on trials that increase their potential agronomic and economic performance. Let’s plan on learning something new and not miss another entire growing season without trying different strategies. After all, you don’t want to be at this same planning stage next year, without having had a good ‘aha’ moment or two.

Make it a plan for any crop

Even if you don’t grow corn, many of these examples work for several crops throughout Western Canada, or anywhere else in the world. A SWAT MAP provides a lot of value and can be fundamental in your farm strategy during the season. Take this time to plan with your SWAT MAPS provider and keep moving forward.

New in-field artificial intelligence technology will enhance sustainability and efficiency from field to fork

AI technologies will provide more information at the sub-field level, providing farmers, ingredient processors and food manufacturers with valuable information starting at the farm through to the final packaged product.

Saskatoon, Sask. — Today, Protein Industries Canada announced an innovative new project in collaboration with Croptimistic Technology, TheoryMesh and C-Merak Innovations aimed at transforming the agri-food value chain through the integration of artificial intelligence (AI) technologies. This initiative seeks to enhance food production efficiency, improve food quality and support sustainability goals from farm to food processor by improving existing precision agriculture tools to enhance data collection and integration at the sub-field level. This will provide food manufacturers with verified data that complies with regulations and meets consumer expectations for transparency in the food they consume. The data collected will also help farmers and ingredient processors access sustainability incentive premiums and access to alternative markets.

“With this project, Protein Industries Canada is supporting greater transparency and traceability throughout the supply chain,” said the Honourable François-Philippe Champagne, Minister of Innovation, Science and Industry. “By leveraging artificial intelligence to enhance precision agriculture practices and increase the adoption of technologies in farming, these project partners are increasing sustainability in the agri-food sector and contributing to a cleaner and healthier environment for Canadians.”

Together, Croptimistic Technology, TheoryMesh and C-Merak Innovations will develop and utilize AI-integrated technologies to consistently collect sub-field-level data and management practices from producers. This data will then be used to predict process settings within the mill to generate high yields and less by-product or waste material, while at the same time, supplying ingredient processors and food manufacturers with the information necessary to support sustainability claims on food products.

“This project will provide Canada with a unique selling advantage, helping us to fully understand our environmental impact from the field to the dinner table. Investments like this will help Canada achieve its sustainability goals and establish itself as a global leader in the sector,” said Lisa Campbell, Senior Director of Programs at Protein Industries Canada.

The project will see $5.4 million co-invested into innovative and scalable AI technologies that will enhance the sustainability, competitiveness and profitability of Canada’s agriculture and food production sector. Protein Industries Canada will invest $2.4 million, with the partners investing the remainder.

“We believe that harnessing the use of AI technology is key to improving the quality and value of the precision ag solutions that we provide to the agrifood industry,” said Phillip Harder, Research Director and Hydrological Scientist at Croptimistic Technology. “To see the data we collect being used to its fullest capabilities beyond the farmgate is a nod to the positive direction we’re heading in with integrating AI technologies to increase agricultural sustainability and food production efficiency.”

“Working with extensive primary farm and food processing data in this project will allow us to use our AI models to improve manufacturing yields, reduce loss and create measurable impact on the sustainability of food production,” said TheoryMesh Co-Founder and CEO Chris Bunio.

"Opting for healthy and sustainable foods isn't just about personal taste; it's a crucial investment in our well-being and the planet's future," said Brett Casavant, CEO of C-Merak Innovations. "By selecting foods that both nourish us and support eco-friendly practices, we're taking control of our health while safeguarding the environment for generations to come. However, finding reliable information to guide these choices can be challenging. That's where AI technology comes in, playing a vital role in providing clear and accessible information from farm to final ingredient. At C-Merak, we're thrilled to collaborate with our consortium partners and Protein Industries Canada to develop innovative solutions that promote healthier people and a healthier planet."

Protein Industries Canada is one of Canada’s five Global Innovation Clusters. Protein Industries Canada and our members are working to embrace the $25 billion opportunity presented by Canada’s ingredient manufacturing, food processing and bio-product sector. Projects such as these add value to, and create new markets for, Canadian crops, generating local jobs and supporting new economic development in locations across Canada. More information can be found at www.theroadto25billion.ca.

For more information:

Sarah Ivey
Protein Industries Canada
sarah@proteinsupercluster.ca
204-914-8467

About Croptimistic Technology

Croptimistic’s vision is to be the global leader in premium precision agriculture services. It is an international AgTech company providing SWAT MAPS, a turn-key variable rate process that combines Soil, Water, and Topography factors of fields for the creation of precision management zones and prescriptions. Their SWAT RECORDS software powers the entire SWAT ECOSYSTEM of products that are synced with the app for real-time viewing. Impressive technology, an expanding service provider network and 98 per cent retention of acres year over year showcase the validation that farmers are seeing value from this premium precision agriculture service. Learn more about SWAT MAPS by visiting swatmaps.com.

About TheoryMesh

TheoryMesh is a Winnipeg, Canada-based software company bringing advanced technology to agriculture and food companies to deliver traceability and sustainability through their supply chains. TheoryMesh’s FarmCapture, FoodTrace, ProcessAI and FoodCertify products are used to digitally transform farms and food companies, providing advanced capabilities to manage data and leverage analytics and AI for better insights. TheoryMesh integrates machine learning, AI and blockchain throughout an integrated platform to provide verifiable traceability, transparency, and sustainability. For more information, visit www.theorymesh.com.

About C-Merak Innovations

C-Merak is a food ingredient manufacturer located in Saskatchewan, Canada. From field to final ingredient, C-Merak offers a closed-loop traceable value chain for quality ingredients you can trust. Harnessing the potential of faba beans and oats, they are evolving the landscape of dry-milled sustainable plant-based food. C-Merak’s diverse ingredient lineup features the innovative FABAFuel Protein 65 per cent Concentrate, FABAFuel Flour, along with starch and fibre options, and the versatile Prairie OATFuel ingredients including groats, flour, rolled flakes, quick flakes, steel cuts, and fibre.

Precision Ag vs. Hydrology: Different Problems, Same Solutions

Precision agriculture has provided farmers with a multitude of tools to manage and optimize crop production. However, there are many different approaches out there to do the same thing, which at the end of the day creates a lot of conflicting information and ideas. So how can we distinguish the signal from the noise at the end of the day? One approach is to look at other disciplines to see how they have handled common problems.

Meet Phillip Harder, Research Director and Hydrological Scientist
Before I started at Croptimistic, I spent 16 years doing academic hydrological research (in different roles from grad student to research associate at the University of Saskatchewan) so it’s been fascinating to explore some of the common challenges faced by both the precision ag industry and the hydrological research community. Here are a few key items that I’ve learned:

1. People Use The Tools They Know

There are many different hydrological models that have different purposes, but hydrologists used the models that they were familiar with or were developed by themselves or their colleagues. Therefore, a lot of hydrological research may be based on using the most convenient model (tool) rather than the best one for the job. Humans tend to stick to habit and often run out of time to try new things, so we often end up using the same tools that we know. There is value in using tools that you know well, but that does not mean that you should use a high lift farm jack for everything. All tools, whether they are hydrological models or precision ag approaches, have a built-in bias to solve a particular problem.  We need to be careful not to apply tools outside of their intended use so that we don’t inadvertently end up with broken jaws.

Case Study: How hydrologists make their choice of model (Addor and Melsen, 2019)
·       1529 published papers published in hydrology between 1991 to 2018 were examined.
·       In 74% of all cases, the model selected was determined by the institution of the paper’s author.

2. Quantifying Spatial Variability in Landscapes

The goal of quantifying spatial variability may vary (hydrologists want to know how much streamflow a basin will produce whereas a farmer is more interested in how a crop will respond to specific management actions), but in the end it’s the same question. In practise this leads to differences in approaches like grid versus zone-based management strategies in precision agriculture (Figure 1), which are similar to fully distributed and hydrological response unit-based approaches in hydrology (Figure 2). A hydrological response unit (HRU) is an area of equivalent hydrological response defined by landscape and soil attributes.  A grid or fully distributed approach often treats the landscape as a grid/raster at a high resolution and every location/grid point needs to have data.

Figure 1 shows a SWAT MAP with a 2-acre grid superimposed on top and it is apparent that this level of gridding does not approach the resolution needed to capture the spatial patterns of the SWAT MAP. A gridded representation of a watershed (bottom left in Figure 2) has significantly more grid elements, which break the landscape up into squares and which all need numbers, versus an HRU equivalent representation which only needs a single set of numbers for each HRU that align with the landscape elements (bottom right in figure 2). In the SWAT zone delineation process we are using the interpretation of electrical conductivity and topographic data, to produce the HRU equivalent but in this case for areas of consistent and stable SWAT properties that will affect crop productivity in similar ways.

There is a long-standing debate in how to think about and divide a landscape in hydrology that reflects what is happening in many precision agriculture discussions. Is the uncertain and indirect information found everywhere (e.g., remote sensing of NDVI) valuable enough to make better decisions as opposed to detailed point scale observations that are required for each grid point?

    Figure 1: SWAT zone representation of a field with a 2-acre grid superimposed over top in black lines.


    Figure 2: Representation of a watershed that defines hydrological response units (bottom right) from the intersection of land use, soil type, slope and sub basins data layers and the equivalent gridded representation (bottom left) (Figure from Johnson et al 2023).

    3. Making Decisions Amid Uncertainty

    The underlying question in this landscape representation debate is, how can we make good decisions when everything is uncertain? Hydrologists have some experience with this. We often have insufficient information and limited data for every variable, and sometimes we need to provide answers in data-scarce situations (a common hydrological example is the prediction of streamflow in an arctic river where there are no stream gauges or weather stations for thousands of kilometers). The same challenge occurs in agriculture, where measuring every relevant soil and fertility variable at every 0.25m grid cell, for every 10 cm soil layer depth, over a field is not economically feasible, but we still want to spatially adjust our inputs to optimize production. So how can we improve our decisions with incomplete information?

      There are two primary approaches to do this in hydrology:

      1. Empirical Models: A hydrologist puts together a conceptual or statistical model of how a hydrological system works and then defines factors to describe the interactions. There is no requirement for any of this to be connected to reality, because with enough data, anything can be calibrated to give a “good” answer. This is a data-driven approach that assumes that the available data can capture all the variability and relationships of interest. The problem is that this approach may not work when conditions are outside the range of the calibration datasets. This is the typical case where correlation works well, but correlation does not imply causation.


      Just because some predictor (like NDVI) shows a correlation with the four years of yield data that we may have, it does not mean that the next year will have the same spatial pattern in yield. For example, we may get a drought where the kochia thrives while the crop fails. Our remote sensing NDVI, that cannot differentiate between kochia and crop, will not capture the significant yield drop.

      2. “Process-Based” Approach:I will state my bias that this is my preferred option. Basically, in this approach, we try to go back to first principles and build a model to focus on physical processes (things that can be described by physics) that we know are true. So, using the same Kochia example, if we know from our SWAT MAP the water holding capacity of a SWAT zone (Figure 3) and weather conditions, we can calculate the amount of crop available water with the SWAT WATER model. Because crop water use efficiency is relatively stable, we can more realistically anticipate the yield in year 5, even if we do not have any data for similar weather conditions.  Not only can we better anticipate and manage for a different outcome, but we will be able to understand why this is occurring which is information to help us do better next time.

      Figure 3:  Spatial variability of the soil field capacity from SWAT WATER (left), yield (middle), and NDVI (normalised difference vegetation index).


      The SWAT MAPS Approach

      We can learn from the similarities between hydrological and precision ag challenges. We should use tools that are suitable for our challenges, not just familiar ones, and base our decisions on process-level understanding, not more irrelevant data. The SWAT MAPS approach follows this principle. It is true that "you can't manage what you don't measure", but we also need to avoid "managing what we measure". Yield is the final agronomic goal, but we do not manage yield directly. NDVI shows biomass patterns, but it may not relate to yield, so we can be led astray. What we manage are inputs, and how their response potential varies with soil, water, and topography. So, focusing on the static soil properties that SWAT MAPS use, and managing them accordingly, gives us the process-based understanding to quantify and manage the spatial variability of crop production.   

      REFERENCES

      Addor, Nans & Melsen, L.A.. (2019). Legacy, Rather Than Adequacy, Drives the Selection of Hydrological Models. Water Resources Research. 10.1029/2018WR022958.

      Johnson et al 2023. https://topsoil.nserl.purdue.edu/~flanagan/erosymp2023/Presentations/23507-Billy_Johnson.pdf

      SWAT Partner Announcement: Peninsula Precision Ag

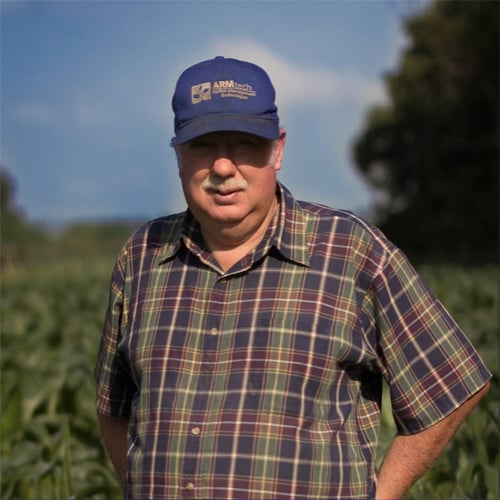
      In order to harness the potential for uptake of precision ag services on the Yorke Peninsula in South Australia, Matt Correll recently founded his business, Peninsula Precision Ag to do just that. Peninsula Precision Ag is a new independent agronomy company and SWAT MAPS service provider, dedicated to helping producers in South Australia utilize premium precision ag services to further their farming operations.

      As an independent agronomist, Correll moved into precision agriculture after exploring software, collecting yield maps and creating prescription applications.

      “I was trying to find ways of narrowing down the data into high-definition layers, which is how I stumbled on EC mapping and what SWAT MAPS offers,” said Correll. “In terms of business, the SWAT ECOSYSTEM allows me to rapidly expand my company through the thought-out planning and products that are available to me. The ongoing support will be essential to continue to develop and learn about how precision ag can be applied to the local growing region.”

      Correll’s clients in Yorke Peninsula mostly grow wheat, barley, lentils and canola. Due to varying soil types, Correll notes that there is great potential for producers in that region to utilize SWAT MAPS to make more informed decisions for their operations.

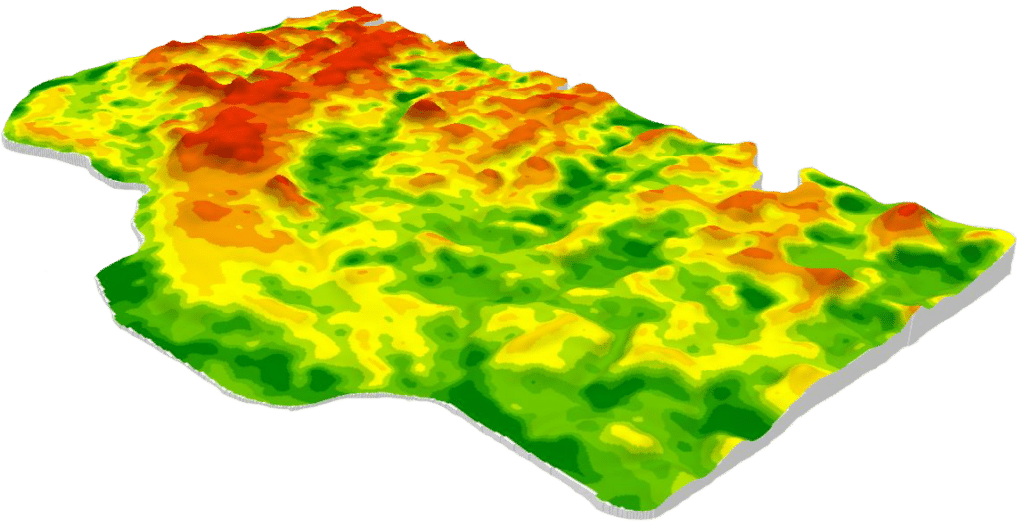
      “People may not understand it at first, but as soon as they see the maps and we talk through the zones with them, they realize it’s a really well drawn-out map of their paddock,” said Correll. “It’s been interesting to think back in time of where that soil was moved over many decades and the elevation data ties it in perfectly. I’m finding some high EC on the mid-slopes and sometimes the depression is slightly lower, and then sure enough the pH is through the roof on the mid-slope rather than on the depression. Once you cover a lot of paddocks, you start to think ‘where would that water have moved’? You can tell a lot by the topography.”

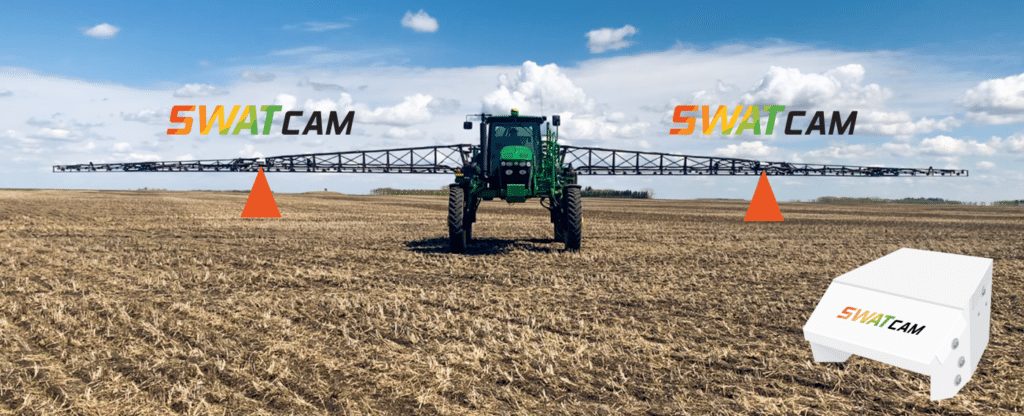
      A local service with experience in precision ag as well as agronomy is an asset to farming operations, and that is exactly the value that Peninsula Precision Ag can provide their clients. Additionally, Correll looks forward to exploring weed management through the use of SWAT CAM and finding more effective herbicides.

      “In my partnership with SWAT MAPS, I’m excited to be creating highly detailed maps compared to the traditional grid sampling method. I’m able to further back up my data and find correlations with nutrient availability on calcareous soils,” said Correll. “My agronomy knowledge and experience with precision ag coupled with the premium products and service that SWAT MAPS offers allows me to help my customers make more informed and more profitable decisions.”

      The SWAT MAPS team is excited to grow their network of service providers in Australia with the new addition of Peninsula Precision Ag. Please join us in welcoming Matt Correll by following him on Twitter @MattCorrell2.  

      Contact:
      Matt Correll
      0438651622
      matt@peninsulaprecisionag.com.au

      How Do I Choose the Right Variable Rate Program?

      Chris Hawkins
      Director of Sales – Farmer Services

      In agriculture today where risk is high and profit margins can become quite thin, variable rate (VR) application programs have emerged as indispensable tools. They allow farmers to optimize input use, enhance crop yields, and maximize profitability, while at the same time minimizing environmental impact. However, with many VR programs and service providers available, farmers face the challenge of selecting the right system for their unique needs.

      Here are some essential factors that farmers should consider before deciding on a VR program and service provider:

      1. Establish Your Objective: There are many reasons why farmers utilize VR application. Increased yield, better pesticide application timing, and improved harvestability are just a few. Decide what problem you are attempting to solve with VR on your farm and find a service provider who will work with you to accomplish that.

      2. Hardware Compatibility: Of course, you will need to make sure your own equipment is capable of, and ready to, apply VR prescriptions. Check with your equipment dealer on that. If it is “ready”, make sure your service provider can write prescriptions that will be compatible with your hardware because prescription files often need to be written specifically to match various types of controllers.

      3. Field Variability (Zones): Many factors can influence variability within a field, and we have tools today to make field zone maps based on ALL of those factors at once (ie. satellite imagery, yield monitors, etc). Generally, these are a good view of “what” variability exists at a specific time (both spatial and temporal variability). However, great VR programs build zone maps based primarily on spatial factors such as soil, water dynamics, and topography (see figure 1). These stable characteristics are an ideal foundation for understanding “why” variability exists in any season.

      Figure 1. SWAT MAP built primarily from spatial field characteristics.

        4. Ground Truthing and Zone Sampling: Make sure your service provider incorporates ground truthing when building the zone maps for your VR program. Ground truthing is the process of comparing what an agronomist sees in a field with their own eyes to the field data that was collected. In this way, the most accurate map possible is chosen as a template for soil sampling. A proper variable rate program includes soil analysis from the same points each year by zone so the agronomist can make precise recommendations based on nutrient changes from year to year.

        5. Scalability: Consider whether the VR service provider can scale with your operation as it grows. The best service providers are innovative and grow with you as they develop and incorporate new technology into their existing programs making their clients even more profitable. In figure 2 below you can see just one example of such technology. SWAT CAM can help to significantly reduce pesticide costs.

        Figure 2. SWAT CAM crop and weed imaging system. Photo: Croptimistic Technology Inc.

        6. Ease of Use: Development of a good variable rate program can be quite complex, however for the farmer, it should be relatively easy to use. The service provider should handle the complexity so you can focus on other aspects of your farm.

        7. Support and Training: Assess the level of support and training provided by the service provider to ensure successful implementation and troubleshooting. Support should be accessible especially in the peak seasons of work. The company should have both live people to speak with as well as online support.

        Figure 3. SWAT SUPPORT portal for learning and support.


        8. Cost/Benefit: When analysing cost/benefit of a variable rate program, look beyond just one year. Sometimes the upfront cost of VR systems may be higher in the first year, but significantly lower in the following years. Further to that, Return on Investment (ROI) is tricky to measure because it is farm specific. It's easy to look at yield alone because that's tangible. However, yield is influenced by many different factors so it should not be the sole measuring stick for the value of a VR program. There are other intrinsic benefits to consider, such as operational efficiency and grain quality. It's very difficult to measure the value of spraying your fungicide at just the right time, or minimizing lodging, but the value needs to be acknowledged.

        9. Reputation: Look for a system that offers high accuracy and precision in data collection, analysis, and application. Research the reputation and track record of the service provider, including their experience in the precision agriculture industry. Seek recommendations from other farmers or agricultural professionals to gain insights into their experiences with the system and service provider.

        10. Regulatory Compliance: Ensure the program complies with local regulations regarding pesticide and fertilizer application, data privacy, and environmental concerns.

          In conclusion, choosing the right variable rate program and service provider is an important decision that can significantly impact the success of your farm. By carefully considering factors such as map development and soil sampling process, scalability, ease of use, support and training, cost/benefit, reputation, and regulatory compliance, you can make informed choices that align with your goals and objectives.

          If you would like to learn more about our VR program which uses SWAT MAPS technology, or any of our new innovations (such as SWAT CAM), please connect with us at sales@swatmaps.com. Or you can find more information on our website at SWATMAPS.com.

          SWAT Partner Announcement: Midplains Ag

          Midplains Ag, a full-service precision ag consultation and risk management group located in Northeast Nebraska, has recently joined the SWAT MAPS service provider network to offer the world’s premier soil foundation map.

          The company was founded in 1983 and has been building a network of farmers located in Antelope, Boone, Holt, Howard, Merrick, Greeley, and Wheeler Counties in Nebraska. Owner Richard Uhrenholdt believes that offering SWAT services that base management zones on soils and topography is the right approach that will allow clients to invest in a long-term plan for soil health.

          Midplains Owner Richard Uhrenholdt

          “We understand the issues that farms face daily and we work closely with our clients to ensure we are collecting and analyzing valuable data that will greatly affect how they make decisions,” said Uhrenholdt. “Utilizing the SWAT ECOSYSTEM will allow us to confidently recommend the next best steps based on what we see happening in the soil.”

          The SWAT service offerings will be an addition to Midplains Ag current full spectrum precision ag offerings that include drone aerial imagery, crop spraying, cover cropping, scouting, soil and crop analysis, irrigation analysis, and yield data.

          Join us in welcoming Midplains Ag to our elite network of SWAT MAPS Service Providers by visiting their website and following them on social media:
          Website - https://midplainsag.com/
          Facebook - www.facebook.com/midplainsag
          Richard Uhrenholdt LinkedIn - https://www.linkedin.com/in/richard-uhrenholdt-a8689772/