High resolution plant stand assessments with SWAT CAM
Brandon Smith
Regional Manager, Central SK
brandon@swatmaps.com
Having a consistent and even plant stand across a field is beneficial in achieving even maturity and maximizing yield. Consistent maturity is critical for fungicide staging (especially for fusarium head blight in wheat) as well as harvest timing. At Croptimistic we use SWAT MAPS to not only vary rates of fertilizer but also to vary seeding rates. This allows us to have a nice, even plant stand. Conditions in the defined SWAT zones will affect seedling mortalities, therefore we can increase seeding rates in those zones to even out plant stands (Figure 1). Typically, zones 1-2 and zones 9-10 will have the highest mortality depending on the field’s soil properties and moisture conditions. These zones will have the highest seeding rates. Zones 1-2 are drier areas of the field that are water-shedding and can often have lighter textured soil, tend to have shallower seeding, and can dry out when it is hot and windy, which increases mortality. Zones 8-10 can often be “mudded in” as these areas are wet when seeding, can have permanent soil issues such as salinity, peat, or sodicity, and these factors again, will increase seed mortality. In the end, we typically prescribe the same amount of seed as we would for a flat rate, but redistribute it to optimize the final plant stand.
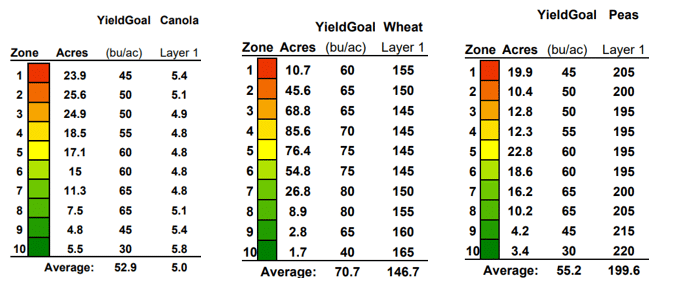
Figure 1: Example of VR canola, wheat, and pea seed prescriptions from left to right. Increasing the seeding rates in Zones 1-2 and 8-10, as these zones have higher mortality.
It is important that we assess our VR seeding rate strategies to ensure that we are hitting our plant stand targets across SWAT zones. Before SWAT CAM, the process for doing this was by manual plant stand counts, which involved counting a few different areas in each zone to come up with an average plant stand count across zones and across the field. This method was very labor intensive and low resolution, since we are counting limited locations in a few fields across a farm to assess our VR seed strategy. As we know, different fields will have different seeding conditions, soil types, and therefore different mortalities. Manual plant stand counts are not able to capture all variability within every SWAT zone across a farm.
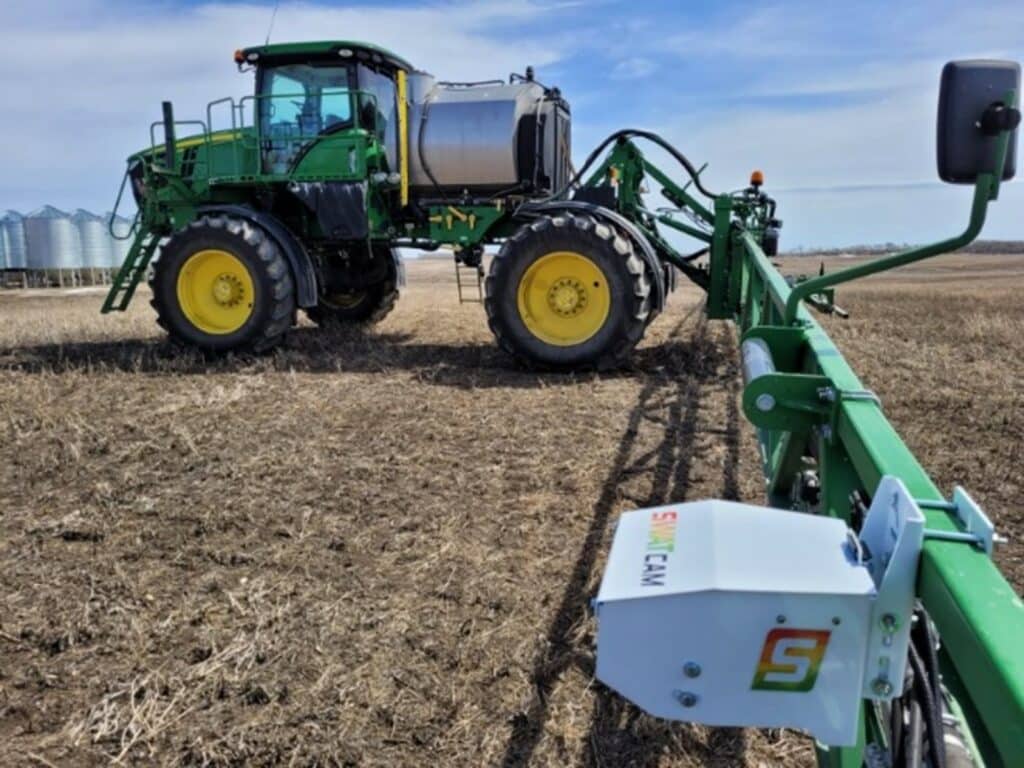
Figure 2: SWAT CAM system mounted to sprayer boom
SWAT CAM is a camera system that is mounted to a sprayer that is automatically capturing 1000s of images on every field, running those images through a machine learning algorithm, and getting plant stand counts for several crops. As of today, SWAT CAM can count individual plants in canola, corn, soybean, dry bean, faba bean, and potato. In 2024 we will be beta testing plant stand counts for cereals and lentils.
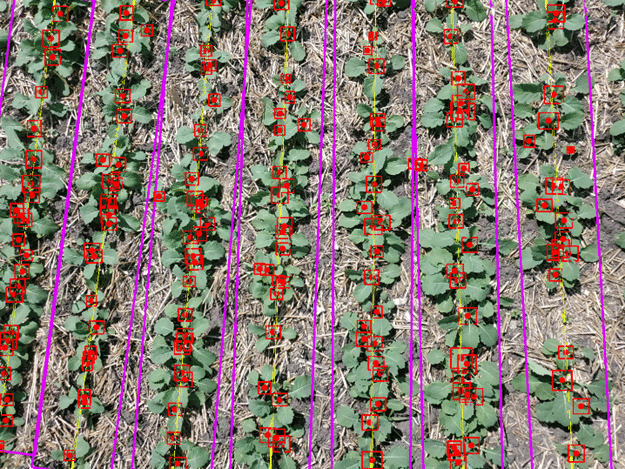
Figure 3: Example of SWAT CAM image with canola plant stand count model.
SWAT CAM allows us to accurately assess our VR seed strategies on the crops that we have plant count models for. As shown in Figure 3, we can count individual canola plants and calculate the average plants per square foot in that image; in this example the average was 5.5 plants per square foot. The seeding rate in this zone was 4.3 lbs/ac and calculated mortality was 44%, which is slightly better than the industry standard for canola seed.
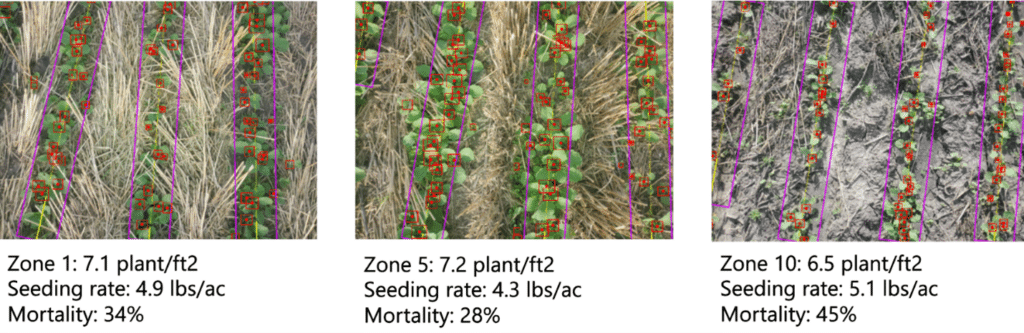
Figure 4: Canola plant stand count by zone with calculated mortalities.
With 1000s of counts across the field analyzed by SWAT zone we can then get an average of the whole field and an average plant stand for each SWAT zone. This data can help us to adjust our VR strategies. For example, if SWAT zone 1 has a higher plant stand than we were expecting, and zone 1 received the highest seeding rate, then in the future we can consider decreasing the seeding rate resulting in reduced seed costs. Another example may be that certain fields on the farm tend to have lower mortality across the whole field and the plant stand is always higher on those fields. This is another opportunity to decrease the seeding rate. Alternatively, fields with higher-than-expected mortality should be investigated further. Do seeding rates need to increase or are there other factors causing the high mortality that need to be altered, such as residue management, fertilizer placement and seed-placed rates?
SWAT CAM data allows us to calculate mortalities across SWAT zones by comparing the seed rates applied to the actual plant counts calculated by SWAT CAM. Automation of this process allows us to capture optimized plant stand counts across full farms at a low cost. SWAT CAM increases our confidence in our plant counts such that we can make better decisions and adjustments to variable rate seed strategies.