Harvest 2025 Prep: Collecting the Best Possible Yield Data
In preparation for harvest, it is important to make sure your combine, GPS, and data systems are ready to go and that you’re set up to make the most of the valuable information your fields produce.
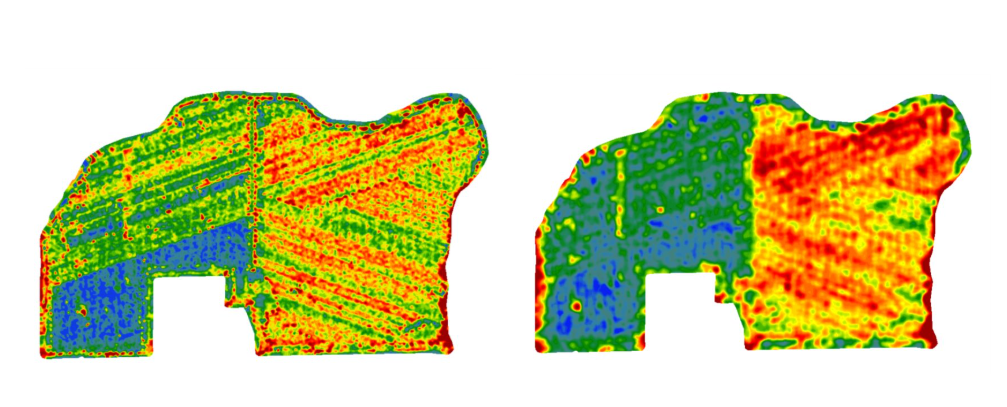
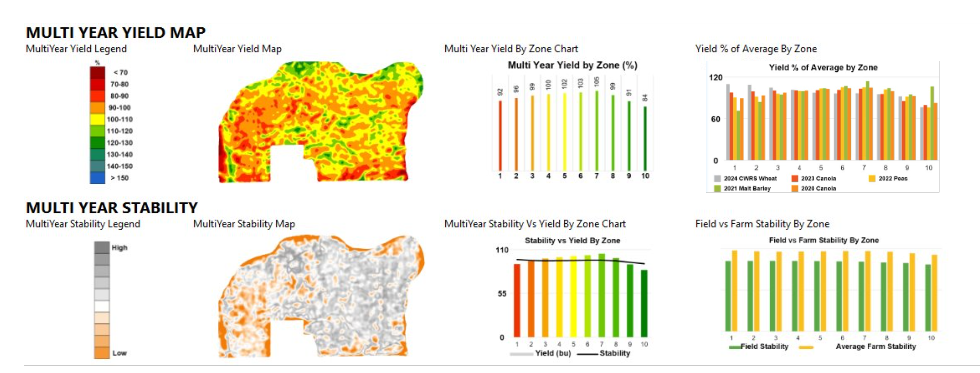
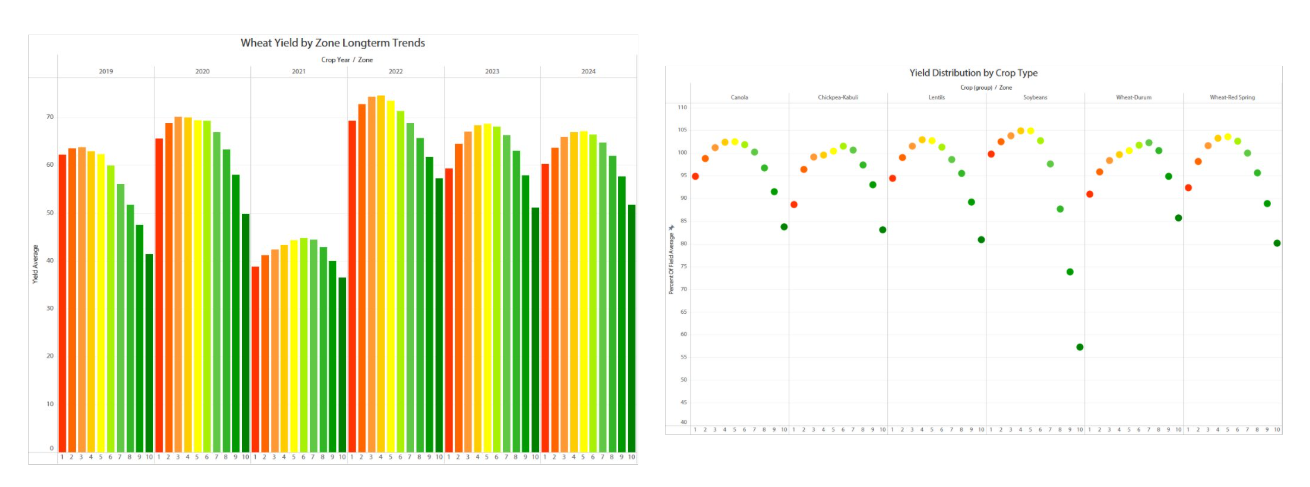
Your yield map is more than just a pretty picture. It’s the foundation for better decisions: identifying which varieties performed, spotting yield-limiting areas, and fine-tuning your inputs for next year. If you haven’t yet signed up for a yield analytics program, this is your chance to turn your harvest data into actionable insights and real ROI. This guide will walk you through key setup tips to ensure you collect the best possible yield information this season.
BEFORE YOU HIT THE FIELD
- Set up your crop types and ensure any field boundaries in your display are accurate.
- Enter consistent client, farm, and field names across all combines.
- Double check that all machines are using the same naming format.
- Confirm your yield monitor software is current.
- If using wireless data transfer service like John Deere Operations Center, Case FieldOps, or Climate FieldView, ensure combines are linked and subscriptions are active.
PLAN FOR CALIBRATION
- Calibrate once per crop per year.
- Be consistent across all combines.
- Calibrate at different flow rates to ensure accurate readings in all conditions.
- Time your flow delay using a stopwatch (grain from header to tank).
- Track total bushels per field for post-calibration.
IN-FIELD BEST PRACTICES
- Avoid changing combine settings mid-field.
- Run combines side-by-side when using multiples in a field.
- Transfer data regularly (via cloud or USB) to avoid losses.
HEADER HEIGHT SETUP: SMALL DETAIL, BIG IMPACT
Your combine’s header height sensor controls when yield data is recorded. If not set correctly, the system can miss harvest data or record when it shouldn’t, leading to gaps or streaks on your map.
How to fix it:
1. Lower the header to your normal cutting height.
2. On your display, set this as your cut height.
3. Save it as your working preset.
When to check this setting:
- When switching headers
- At the start of harvest
- When crop conditions change and require header height adjustments
- Any time you calibrate
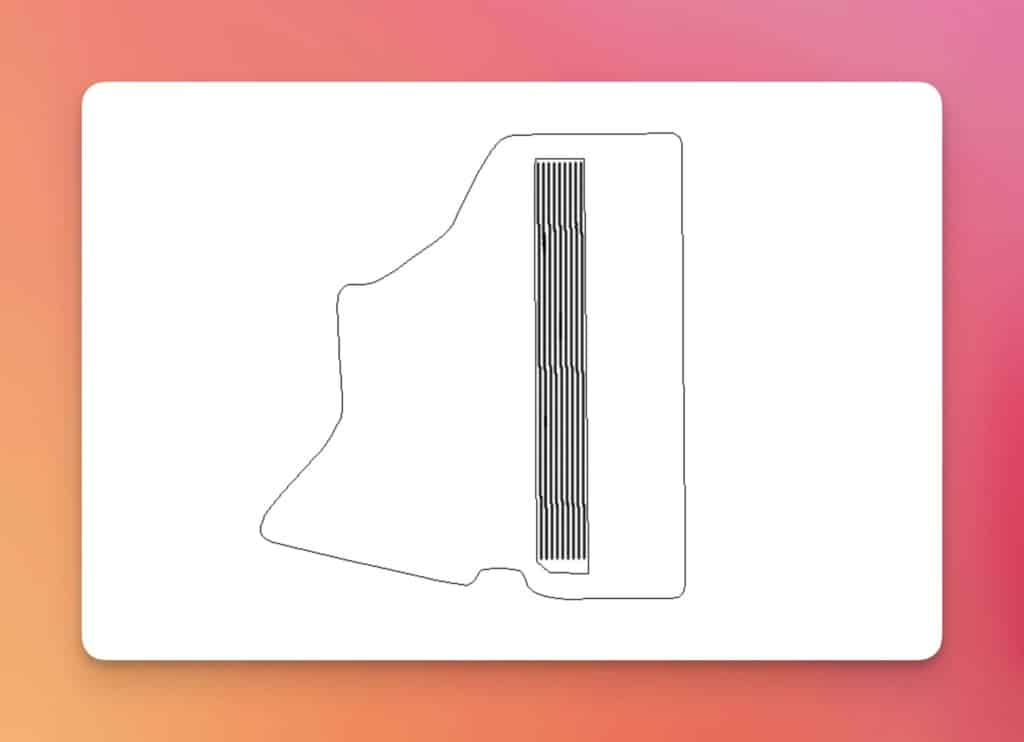
USING AUTO SWATH
Auto Swath is a great tool when your equipment and GPS signals are working reliably. It helps reduce operator input and keeps mapping consistent. In certain conditions, Auto Swath can cause more harm than good by guessing the wrong width or shutting off recording too early or late
Use Auto Swath if:
- You have SF1, SF3, or RTK correction
- Your header is automatically detected
- You're in wide-open areas with strong GPS signal
Turn it off if:
- You're using WAAS or no GPS correction
- Maps show striping or streaks
- You're in hilly, wooded, or signal-poor areas
- Your header width isn’t detected correctly
- You’re using after market or specialty headers
Pro tip:
If in doubt, set the swath width manually and turn Auto Swath off until you're confident in GPS accuracy.
SOLAR FLARES AND GPS WARNINGS FOR 2025
We’re entering the peak of Solar Cycle 25, meaning more solar flares and geomagnetic storms could occur during harvest in Western Canada. We can’t predict when a solar storm will hit and most geomagnetic events are minor (G1–G2) and go unnoticed but stronger events can cause temporary headaches with equipment.
Why it matters:
- GPS drift or signal loss
- Interference with RTK or mobile data corrections
- Potential issues with satellite tools (e.g., imagery or weather data)
What to do:
- Monitor alerts from NOAA or Natural Resources Canada
- Use RTK or subscription corrections when possible
- Avoid calibrating during solar storm warnings
- Know how to switch to manual mode if GPS fails
GOOD DATA = BETTER DECISIONS
Accurate yield maps help you:
- Make smarter input decisions next season
- Compare varieties and trials with confidence
- Truly understand your field’s performance
Don’t let small setup details or missed opportunities undo a full season of hard work.
Contact us today to learn more about our yield analytics program and see how your harvest data can work harder for you. We’ll help you set up your equipment, collect reliable data, and turn your maps into a plan for bigger profits next season.